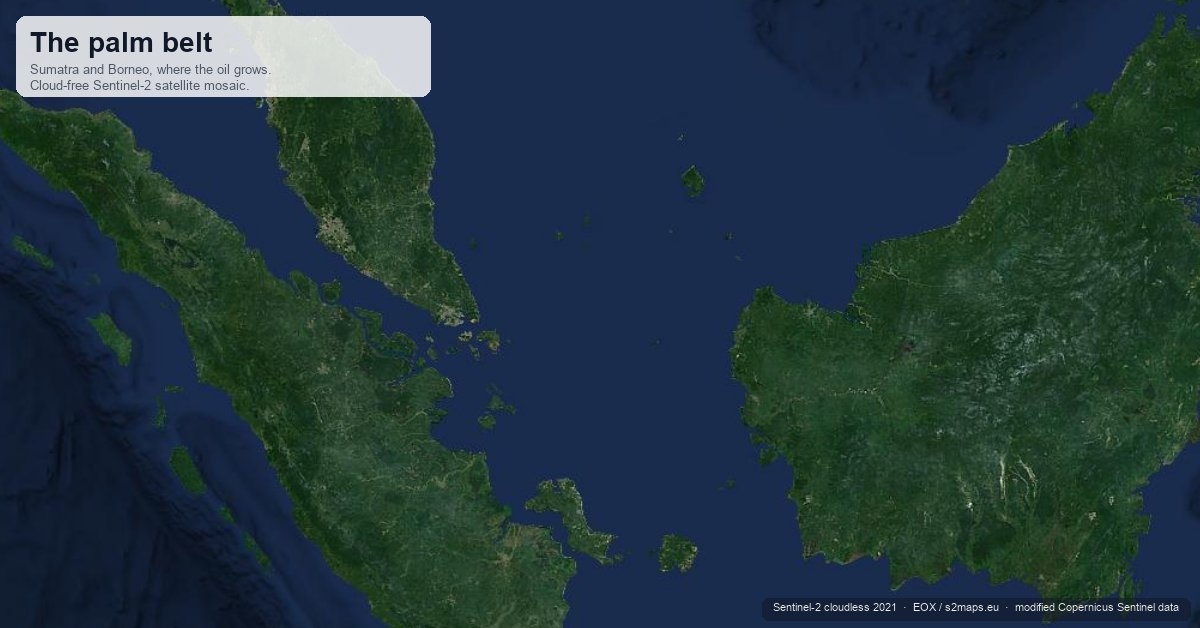
Some years ago I sat in a meeting with a Southeast Asian energy minister when his phone rang and it was the prime minister on the line. The complaint I overheard afterwards was blunt and it has stayed with me. The Europeans want to ban our palm oil from their fuel, he said, so it will just go into our own biodiesel. He did not present this as a threat. He presented it as arithmetic, the way a man states the weather. Europe would feel virtuous, the palm would keep flowing, and the forest would notice none of it.
This brief is a test of whether he was right. The measure he meant is the EU’s Renewable Energy Directive, which from 2019 caps how much palm-based biofuel counts toward Europe’s renewable-energy targets and phases that eligibility to zero by 2030 [1]. People call it a palm-oil ban, though it bans nothing outright: it strips palm fuel of the subsidy-grade status that made it worth using, and it touches only fuel, not the palm in your soap or your chocolate. The question that matters is not what Brussels intended but what the tonnes actually did, and those are two different stories. Live figures and the full source trail sit on the policy-effect monitor, which scores the measure link by link.
What the measure did on its own terms
Start with the part that worked, because it did work. European palm imports fell hard. Total palm into the EU dropped from about 7.1 million tonnes in 2019 to 3.8 million by 2023, a fall of nearly half [2]. The slice the directive actually targets, palm burned for fuel, fell faster still: from its 2019 peak of about 4.5 million tonnes it dropped 27 percent in 2022 alone, and from 2023 palm biofuel stopped counting toward the EU’s renewable mandates entirely, putting the fuel slice on a mandated path to zero [3]. On its own terms the instrument fired. If the goal was to get palm out of European tanks, Brussels achieved it, and the WTO panels in the Indonesian and Malaysian disputes have let the environmental objective stand while faulting the methodology behind it, a distinction now heading into the retaliation phase.
So a European official can point at a falling line and call it success. The trouble is that the line measures European throughput, not palm oil, and the two part company the moment you look past Europe’s own fuel pool.
The waterbed
Palm oil is fungible and the world is large. The oil Europe declined did not sit unsold; the lost demand was absorbed into a world market where Indonesia’s own biodiesel mandate was expanding fastest. Over exactly the years the EU was drawing down, Jakarta ramped its own biodiesel mandate from a 20 percent blend to 40, and the palm feeding that mandate climbed from 3.2 million tonnes in 2016 to 13.3 million by 2025 [5]. Set those two numbers beside each other and the minister’s arithmetic is on the table. Indonesia’s domestic program now swallows more than three times the entire European biofuel appetite the phase-out removed.
The rest went to sea under a different flag. In a single year, 2022 to 2023, Indonesian exports to China rose by about 1.5 million tonnes and to Africa by 1.0 million, each swing on its own larger than Indonesia’s entire 0.4-million-tonne drop in shipments to the EU, while India kept taking its share [7]. Production did not collapse: through year-to-year weather and market dips Indonesian output stayed broadly resilient, drifting from about 45 million tonnes to 47.5 across the phase-out, and the domestic share of that output rose from a third to nearly half [6][8]. The palm was not stranded. It was rerouted.
The tonnes tell the story in one view.
| Trade flow, million tonnes | Then | Now |
|---|---|---|
| EU-27 total palm imports | 7.1 (2019) | 3.8 (2023) |
| EU palm burned for fuel | 4.5 (2019, the peak) | zero-rated from 2023, phasing to nil |
| Indonesia’s own biodiesel palm | 3.2 (2016) | 13.3 (2025) |
| Indonesian palm production | 45 (2019) | 47.5 (2026) |
| Indonesian exports to China | 6.3 (2022) | 7.7 (2023) |
| Indonesian exports to India | 5.5 (2022) | 6.0 (2023) |
| Indonesian exports to the EU | 4.1 (2022) | 3.7 (2023) |
| Indonesian exports to Africa | 3.2 (2022) | 4.2 (2023) |
Sources by row: EU imports [2], palm for fuel [3], Indonesia’s domestic biodiesel [5], production [6], export destinations from GAPKI [7]. The series span different years, shown in each cell.
A general-equilibrium model at the Kiel Institute puts a figure on the leak. In its scenario a 75 percent cut in EU palm imports reduces production in Indonesia and Malaysia by only about 1.8 percent [4]: the withdrawn tonnes are a small and shrinking slice of a fungible world market, so most of what Europe stops buying is bought by someone else rather than never grown. The peer-reviewed estimate of how much of the deforestation pressure leaks sits near half [9], and the production models put the demand leakage higher still. This is the waterbed. Press it down under one hand and it rises under the other, and the water is mostly conserved.
| The EU’s case for the phase-out | Verdict | The load-bearing number |
|---|---|---|
| Palm is high indirect-land-use-change risk, its cultivation expands into forest and peatland | Documented | under the 2019 rule the only feedstock meeting the test, over 1 percent a year and 100,000 hectares of area growth, a tenth of it onto high-carbon-stock land; the 2026 review keeps palm and adds soy [1][22] |
| Counting palm biodiesel undercuts the climate goal, it emits more than fossil diesel once that land-use change is included | The Commission’s own modelled basis | GLOBIOM for the Commission put palm biodiesel at roughly three times the emissions of fossil diesel [21] |
| Taking palm out of European fuel cuts palm demand and its pressure on land | No, the demand leaks | a 75 percent import cut is modelled to yield only ~1.8 percent less production; most of the demand is displaced, not removed [4] |
| and the phase-out therefore spares forest | Barely | even a full EU ban avoids about 1.6 percent of Indonesian deforestation [9] |
The forest kept its own clock

Here the story turns, because Indonesian deforestation genuinely did fall, and fall steeply, from around 930,000 hectares of primary forest lost in 2016 to a twenty-year low near 200,000 by 2021 [11]. An advocate can hold that decline up next to the European measure and imply a handshake between them. The dates refuse to cooperate. The fall began in 2017. RED II was not adopted until the end of 2018, and its palm designation came in 2019. A cause cannot trail its effect by two years.
What the decline actually tracks is closer to home for the growers. Palm prices had collapsed by roughly half between 2011 and 2019, and cheap palm plants no groves; the elasticity in the literature is clean, a one percent fall in price against a two-thirds percent fall in clearing [11]. Indonesia’s forest moratorium, wet La Nina years that kept the fire season quiet, and the corporate no-deforestation pledges did the rest. The modellers who tried to isolate the European contribution keep landing on the same small number. Even an outright EU ban, in the counterfactual, would spare about 1.6 percent of Indonesian deforestation, because half the restricted supply leaks and palm is only a third of the clearing to begin with [9]. A separate global model puts the whole EU-only effect on land-use emissions below one percent [10]. These are rounding errors dressed as policy.
And then the forest answered again. As palm prices recovered and the domestic biodiesel push accelerated, clearing rebounded, up 66 percent in 2025 to an eight-year high, a surge that reporting associates with Indonesia’s food-and-energy self-sufficiency drive, oil-palm and bioenergy expansion, and mining pressure [13]. The curve tracks prices and Jakarta far more closely than Brussels.
One honesty note belongs here, because it is the sort of thing this site exists to say out loud. Even the reality has more than one official version. For 2024, the satellite record shows Indonesian forest loss falling 11 percent while Indonesia’s own government system shows it rising 61, because the two count different things over different years, and officials tend to quote whichever number flatters [12]. When the measuring instruments disagree by that much and in that direction, the first job of an honest page is to name which instrument it is holding, not to pretend the disagreement away.
The carrot outworked the stick
If the eligibility phase-out was the stick, there was a carrot running alongside it, and the carrot has the better claim to have moved anything. Western buyers and their banks leaned on the big refiners through the 2010s until no-deforestation commitments covered 83 percent of Indonesian and Malaysian refining capacity by 2020 [16]. That pressure is the most plausible reason large-scale corporate clearing fell when it did. The tell is a single stubborn fact: in 2021 deforestation stayed at its twenty-year low even as palm prices spiked back above their 2010 highs, exactly when the old price-drives-clearing relationship predicted a surge. Something non-price held the line, and buyer pressure is the candidate with the timing to match. This is a timing-and-mechanism argument, not proof of a single cause, which is why this page carries an inferred label rather than a measured one.
The certification badge, though, is weaker than its marketing. Roundtable-certified palm covers a fifth of world production, but only about two-thirds of it is ever sold at the certified premium, and the premium itself runs a couple of dollars a tonne, often less than the cost of getting certified [17]. The rigorous evaluations are sobering. Certification cut deforestation by a third inside certified concessions, which sounds like a win until you read that those concessions held under one percent of the forest left to clear, so the third applies to almost nothing [14]. The newest meta-analysis is blunter: once you count the clearing that simply moves to uncertified land next door, the pooled effect of certification on deforestation is statistically indistinguishable from zero [15].
There is a final irony worth keeping, and it sits inside the regulation itself. RED exempts palm certified as low indirect-land-use-change risk from the phase-out, which means the stick quietly grew a carrot: certify, and keep your European market. Read loosely, that carve-out could re-admit around 8 million tonnes a year by 2030, roughly double the palm the EU was burning for fuel in 2017, with no real change on the ground [20]. The instrument built to shut a door left a window open and labelled it sustainable.
The barrels that tried to come back
What replaced palm in European biodiesel was used cooking oil, and a growing share of it now arrives from China, EU purchases up 39 percent in a single year [18]. Used cooking oil is a genuinely good feedstock, waste turned to fuel, and there is nothing wrong with the honest article. The catch is that “used cooking oil” is a category defined by its history rather than its chemistry, and history is exactly what a shipping document can invent. The suspicion is that some of that UCO is virgin palm wearing a waste label, which would mean part of the palm Europe kept out of the front door is coming back through the pantry. That fraud suspicion is a separate matter from the EU’s anti-dumping case: the provisional duties of 2024, made definitive in February 2025, targeted the dumped pricing of Chinese biodiesel, and they show the flows had grown commercially significant, but they do not by themselves prove the UCO was palm in disguise.
This is where a monitor earns its keep, because the claim is checkable in the trade data as it lands. The policy-effect page carries a live panel on China’s share of EU HS 1518 imports, the trade line where any relabelled palm would show up. Rising Chinese UCO is not proof of fraud. It is the channel where fraud, if it exists, has to pass, and it is already in litigation. Watch the line.
The general lesson, and why it is not only about palm
Pull back to the eagle’s height and the palm case stops being about palm. It is a clean instance of a rule that governs any environmental measure that works by withdrawing demand: a restriction a producer can escape by selling to someone else does very little to the thing it names. The accounting boundary is not the forest. It is a place where demand is redirected, and demand redirected is production preserved.
Before anyone reads this as a case for doing nothing, the opposite trap is just as real. Swap palm for rapeseed or soy and you can make the climate worse, because those crops yield far less oil per hectare and so demand more land for the same litre of fuel; a blunt substitution can move emissions the wrong way [19]. The lesson is not that Europe should stop. The lesson is about where a policy has to reach to bite. Demand rules move who buys the dirty product, not whether it is made. Only measures that reach the producer, through finance, conservation, and the buyer pressure that actually held the line in 2021, change what gets grown and what gets cleared.
That is a testable proposition, and the EU is about to run two more experiments on it. The Carbon Border Adjustment Mechanism prices the carbon in imported steel, cement and aluminium, and the same question applies: does it cut emissions, or does it reshuffle which mill ships to Europe while the dirty tonnes find other customers, the phenomenon the trade economists call resource shuffling. The Deforestation Regulation, which demands that soy, beef, cocoa and palm entering the EU come from unclear land, faces the mirror of the palm story: does it spare forest, or does it split the world into a clean pile for Europe and a dirty pile for everyone else, with the same trees falling for the second pile. Both are scoreable the way the palm ban was scoreable, against measured trade and measured land, and both belong on the same shelf.
Three scenarios for 2026 to 2030
The framing below is this analyst’s reading, not a quantitative forecast.
Scenario A: the loophole swallows the ban. The low-ILUC exemption and relabelled UCO between them keep palm-derived feedstock flowing into European fuel at volumes not far below the pre-ban level, while the headline import series still shows a proud decline. The measure survives on paper as its own evasion grows underneath it. I think some version of this is the base case; the incentives all point at it, and the enforcement is thin.
Scenario B: the border regulations converge on the producer. The Deforestation Regulation’s traceability, done seriously, does what the import ban could not, because it follows the plot of land rather than the tonne, and CBAM’s reporting slowly forces real emissions data up the supply chain. The EU stumbles into producer-side leverage through paperwork rather than principle. Possible, and the more hopeful path, but it depends on enforcement appetite that Brussels has rarely sustained.
Scenario C: retaliation resets the board. The WTO retaliation arbitration and the wider trade friction with Jakarta and Kuala Lumpur push the palm measures into renegotiation, the exemptions widen as a concession, and the whole apparatus is quietly hollowed in the name of trade peace. Lower probability near term, but the DS593 clock is already running.
Implications
For European policymakers, the uncomfortable read is that the phase-out worked narrowly and failed broadly: it cleanly took palm out of Europe’s fuel accounting, and it bought very little forest. The next two regulations will fail the same way unless they reach past the demand side to the plot and the mill. Score them honestly and early, before the political story hardens.
For producer governments, the minister was right, and the rightness cuts both ways. Demand rules abroad are easy to neutralise, but the domestic biodiesel mandate that neutralised them is now itself a rising driver of the clearing, which makes it a domestic problem wearing an energy-security costume.
For importers and their financiers, the leverage that actually worked was yours, the buyer and lender pressure behind the no-deforestation commitments, and it is leaking through the untraceable smallholder share of supply. The traceability the new regulation forces on you is also the tool that could plug that leak, if you treat it as more than a compliance cost.
The barrels moved. Whether the next set of European measures moves anything the forest can feel is still unsettled, and it is the question I would put to that minister today: not whether Europe can keep palm out of its fuel, which we now know it can, but whether anyone has built a rule that the market cannot simply route around. If you can point me to one that has survived contact with the trade data, I would genuinely like to see it.
References
[1] European Union. Directive (EU) 2018/2001 (RED II), Article 26, and Delegated Regulation (EU) 2019/807: palm designated high indirect-land-use-change risk, frozen at 2019 levels and phased to zero by 2030; biofuel scope only. https://eur-lex.europa.eu/eli/reg_del/2019/807/oj/eng
[2] IndexMundi (USDA PSD-derived). EU-27 palm oil imports, 7.1 Mt (2019) to 3.8 Mt (2023). https://www.indexmundi.com/agriculture/?country=eu&commodity=palm-oil&graph=imports
[3] Transport & Environment (biofuels update, December 2023). EU palm biodiesel peaked at 4.5 Mt in 2019, then fell, down 27 percent between 2021 and 2022; from 2023 palm biofuel no longer counts toward EU renewable mandates. https://www.transportenvironment.org/uploads/files/202312_TE_biofuels_update_report-1.pdf
[4] Heimann et al. (2024). “Phasing out palm and soy oil biodiesel in the EU,” GCB Bioenergy 16:e13115 (DART-BIO model): a 75 percent EU palm import cut yields ~1.8 percent less production in Malaysia and Indonesia. https://doi.org/10.1111/gcbb.13115
[5] USDA FAS GAIN. Indonesia Biofuels Annual (ID2025-0029): domestic biodiesel palm uptake 3.2 Mt (2016) to 13.3 Mt (2025); B20 to B40 mandate ramp. https://apps.fas.usda.gov/newgainapi/api/Report/DownloadReportByFileName?fileName=Biofuels+Annual_Jakarta_Indonesia_ID2025-0029.pdf
[6] USDA PSD Online. Indonesian and world palm oil production, rising across the phase-out window. https://apps.fas.usda.gov/psdonline/app/index.html
[7] GAPKI. Indonesian palm exports by destination, 2022 to 2023: EU minus 11.6 percent, China plus 23, Africa plus 33, India plus 8. https://gapki.id/en/news/2024/02/28/palm-oil-industry-performance-in-2023-prospects-for-2024/
[8] Trase / Stockholm Environment Institute. Indonesian domestic palm use, 32 percent of production (2018) to 44 percent (2022). https://www.sei.org/features/indonesian-palm-oil-exports-and-deforestation/
[9] Busch et al. (2022). Environmental Research Letters 17:014035: an EU restriction avoids ~1.6 percent of Indonesian deforestation; ~52 percent leakage, supply elasticity 0.13, palm ~32 percent of clearing. https://iopscience.iop.org/article/10.1088/1748-9326/ac435e
[10] Yarlagadda et al. (2025). Nature Communications 16:1520 (GCAM): EU-only palm freeze cuts global land-use-change CO2 negligibly; top-five-importer extension ~0.8 percent. https://www.nature.com/articles/s41467-025-56693-1
[11] Gaveau et al. (2022). PLOS ONE: Indonesian primary forest loss 930,000 ha (2016) to ~203,000 (2021); price elasticity of clearing 0.68. https://journals.plos.org/plosone/article?id=10.1371/journal.pone.0266178
[12] Global Forest Watch / University of Maryland; Indonesia SIMONTANA. 2024 divergence: satellite minus 11 percent vs official plus 61 percent. https://www.globalforestwatch.org/dashboards/country/IDN/
[13] Auriga Nusantara / TheTreeMap via Mongabay. Indonesian deforestation up 66 percent in 2025, an 8-year high. https://news.mongabay.com/2026/04/indonesias-deforestation-surges-66-in-2025-reversing-years-of-decline/
[14] Carlson et al. (2018). PNAS 115(1):121-126: RSPO cut deforestation ~33 percent inside certified plantations, which held under 1 percent of remaining forest. https://www.pnas.org/doi/10.1073/pnas.1704728114
[15] Sibhatu & Qaim (2026). Environmental Research Letters, meta-analysis: pooled net effect of certification on deforestation statistically insignificant after leakage. https://iopscience.iop.org/article/10.1088/1748-9326/ae803b
[16] Chain Reaction Research. NDPE policies covered 83 percent of Indonesian and Malaysian refining capacity by 2020. https://chainreactionresearch.com/report/ndpe-policies-cover-83-of-palm-oil-refineries-implementation-at-75/
[17] Roundtable on Sustainable Palm Oil. Certified volume ~19-20 percent of production; ~64 percent sold as certified; small premium. https://rspo.org/updated-cspo-and-cspko-production-and-sales-data/
[18] Transport & Environment; European Commission. Used cooking oil as the main palm substitute, much from China (+39 percent in 2024); mislabelling concern; EU provisional anti-dumping duties on Chinese biodiesel August 2024, made definitive February 2025 (Commission Implementing Regulation (EU) 2025/261). https://www.transportenvironment.org/articles/european-and-us-used-cooking-oil-demand-increasingly-unsustainable-analysis
[19] Escobar et al. (2023). Science of the Total Environment: substituting palm with lower-yield oils can increase forest loss and emissions. https://www.sciencedirect.com/science/article/pii/S0048969723081160
[20] ICCT. RED low-ILUC-risk exemption could re-admit ~8 Mt/yr of palm to EU biofuel by 2030 with no ILUC reduction. https://theicct.org/the-low-iluc-loophole-could-allow-business-as-usual-palm-oil-imports-for-biodiesel-in-europe/
[21] GLOBIOM / Valin et al. (2015). “The land use change impact of biofuels consumed in the EU,” Ecofys, IIASA and E4tech for the European Commission: once indirect land-use change is counted, palm biodiesel emits roughly three times as much as fossil diesel (the study’s palm ILUC factor is about 231 gCO2e/MJ against a 94 gCO2e/MJ fossil comparator); this is the modelling basis the Commission cited for the high-ILUC-risk designation, and it is a modelled indirect-land-use-change result, not a measured tailpipe figure. https://www.transportenvironment.org/articles/eu-classifies-palm-oil-diesel-unsustainable-fails-cut-its-subsidised-use-and-associated
[22] European Parliament Legislative Observatory; European Commission. Delegated Act procedure 2026/2680(DEA), C(2026)2306, adopted 10 April 2026, amending Delegated Regulation 2019/807: soybean oil classified high indirect-land-use-change risk and phased out of RED renewable-fuel eligibility by 2030, palm retained; under Parliament and Council scrutiny, with an ITRE committee objection adopted 24 June 2026. https://oeil.europarl.europa.eu/oeil/en/procedure-file?reference=2026%2F2680%28DEA%29 (USDA FAS explainer: https://www.fas.usda.gov/data/gain/2026/04/european-union-european-union-phase-out-use-soy-based-biofuels)
Trade and production figures are USDA, GAPKI and Eurostat-derived annual data to 2025; the displacement and deforestation magnitudes are peer-reviewed model outputs, cited as such. The live used-cooking-oil leakage panel and the full link-by-link scoring sit on the policy-effect monitor, which names its data system on every deforestation figure. This is case one of a series; CBAM and the Deforestation Regulation are next.