Two questions keep arriving in this analyst’s inbox. Why has a year and a half of drone strikes on Russian refineries, and now five months of Gulf war, done so little to the price of crude oil? And why does filling the tank cost so much if crude is so cheap? On 20 July, regular gasoline in the United States averaged 4.00 dollars a gallon; on-highway diesel averaged 5.13 [3]. The two questions do not contradict each other. They describe two different markets, crude oil and the refined products made from it. This brief tries to answer them together at the system scale, where even the published numbers rarely match until you ask what each one measures. The country-by-country diagnoses are a separate and slipperier story, saved for later.
Even scheduled maintenance is now news. When Irving Oil confirmed a planned September-to-mid-November turnaround at its Saint John refinery, Canada’s largest, Bloomberg treated it as a threat to US northeast supply [1][2]. A turnaround is announced years ahead and planned down to the crane rental. That one now reads as a warning says something about the margin the system is running on.
The comfortable answer to both questions sits in one number. The world has 104.5 million barrels per day of refining capacity and ran 83.0 in 2024 [4]. A cushion of 21.6 mb/d. Two wars, the US-Israeli war with Iran and Russia’s war in Ukraine, have pulled about 8.3 mb/d of refining capacity out of normal operation by mid-July, about 8% of the global kit. The crude runs actually lost are nearer 5 mb/d; the bridge between those two figures is printed below, because the gap between them is where careless reading starts [5][26]. On paper, either number is a fraction of the cushion. Most of this brief is about what the paper leaves out.
Live facility statuses, the operating-capacity tally and the regional runs data sit on the refinery status map, updated as events are verified. The price side of the story, crude cushioned while diesel cracks broke records, runs on price transmission [26].
The comfort blanket
In 2024, the world’s refineries processed 83.0 mb/d against 104.5 mb/d of nameplate capacity [4]. That is 79% utilization, and the gap has been there for a decade: capacity crept from 97.9 to 104.5 between 2014 and 2024 while actual runs stayed between 75 and 83.
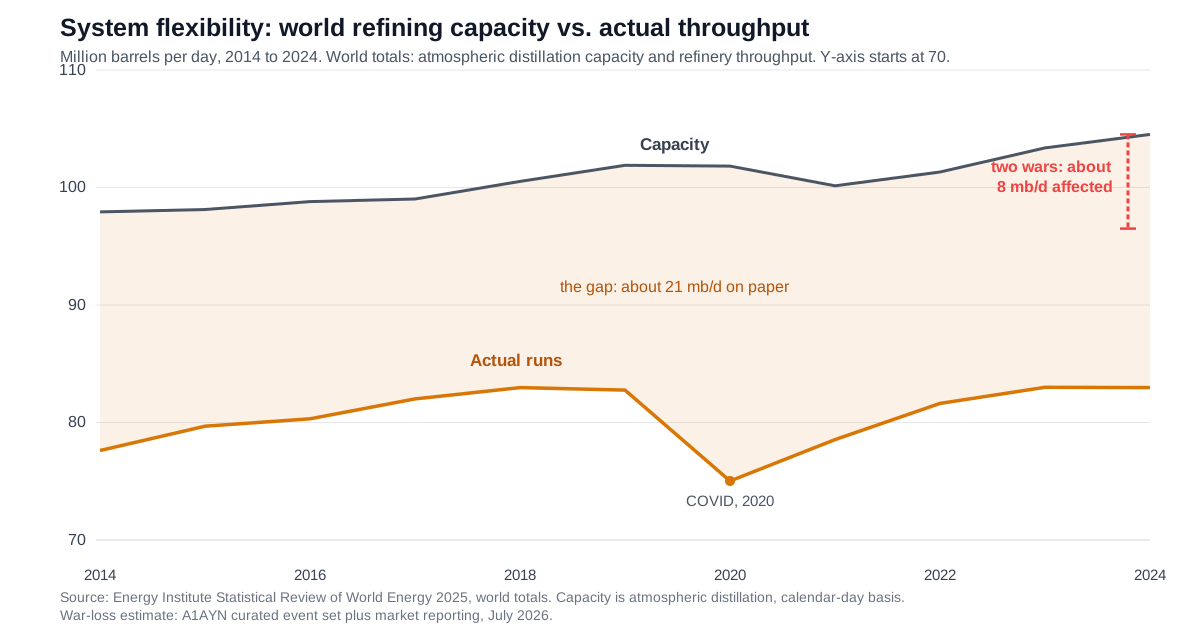
A nameplate is what a plant could do new, whole and lucky. Real refineries take maintenance, lose units to fires, run whatever crude they can get rather than the crude they were designed for, and sell only into the demand they can reach. So before treating 21.6 mb/d as a reserve, look at where it sits.
| Region | Capacity, mb/d | Actual runs, mb/d | Utilization | Headroom, mb/d |
|---|---|---|---|---|
| North America | 21.9 | 18.9 | 86% | 3.1 |
| S. & Cent. America | 6.3 | 4.0 | 63% | 2.3 |
| Europe | 15.0 | 11.8 | 78% | 3.2 |
| CIS | 8.4 | 6.6 | 79% | 1.8 |
| Middle East | 11.7 | 9.3 | 79% | 2.4 |
| Africa | 3.5 | 1.9 | 56% | 1.5 |
| Asia Pacific | 37.7 | 30.5 | 81% | 7.2 |
| World | 104.5 | 83.0 | 79% | 21.6 |
mb/d, 2024. Energy Institute Statistical Review 2025, world and regional totals [4]. Rows are computed from unrounded values, then rounded for display; that is why North America shows 3.1 where the rounded columns imply 3.0.
Africa runs at 56% of nameplate, South and Central America at 63%. Nobody in Lagos or Punto Fijo is holding a refinery in reserve for a tight market. Nigeria imported gasoline for decades while its state refineries sat idle. Venezuela’s Paraguana complex was at about a quarter of capacity before June earthquakes took out its grid; Amuay came back at about 140 kb/d [23]. Broken plants carry nameplates too.
Asia Pacific holds 7.2 mb/d of the apparent gap, the biggest single block, much of it Chinese. Those plants can run. Beijing decides how hard, through production quotas, and decides for whom, through export licences. Spare in physics, spoken for in policy.
The CIS and the Middle East entered the wars with 1.8 and 2.4 mb/d of regional headroom. Affected capacity now exceeds the entire pre-war headroom in both. The regions that might have cushioned a shortage need cushioning themselves.
What is left is North American and European, perhaps 6 mb/d of functioning crude-distillation headroom connected to markets and export terminals. Even that flatters. Distillation is the first tower a barrel enters, not the last; extra crude runs become extra on-spec diesel only if the hydrotreaters, the hydrogen and the conversion units are there too, and much of Europe’s idle kit was built for a gasoline demand that has been shrinking for years.
So the 21.6 splits three ways: broken, spoken for, and genuinely spare but often the wrong shape. As a working guess, perhaps a third of it was ever dispatchable, and even that assumes owners leave working refineries idle by choice. Mostly they do not. A refinery costs too much to build to stand still without a reason, and the reasons here are wreckage, policy and permanent closure.
The wrong shortage
Crude has an institutional apparatus built for exactly this kind of year: OPEC spare capacity, strategic reserves on three continents, futures curves that price storage by the month. The apparatus frayed. The UAE left OPEC+ on 1 May, quota discipline was already slipping, and much of the group’s spare capacity sat behind a constrained shipping lane [33][34]. Crude stayed calm anyway; stock releases and plain demand destruction were enough. The market has judged that there is still enough oil. Whether that judgment holds, time will tell.
Products have no such apparatus. There is no OPEC of diesel and no swing producer of jet fuel, and product stocks are fragmented by grade, geography and national law. What the product market has instead is refineries. Refineries are what the drones keep hitting.
The same war therefore looks calm through crude and severe through diesel cracks, and one mechanism makes it worse: what Russia cannot refine it can still sell as crude, adding to the barrel the world already has enough of while removing the product it is short of [26].
Three pumps
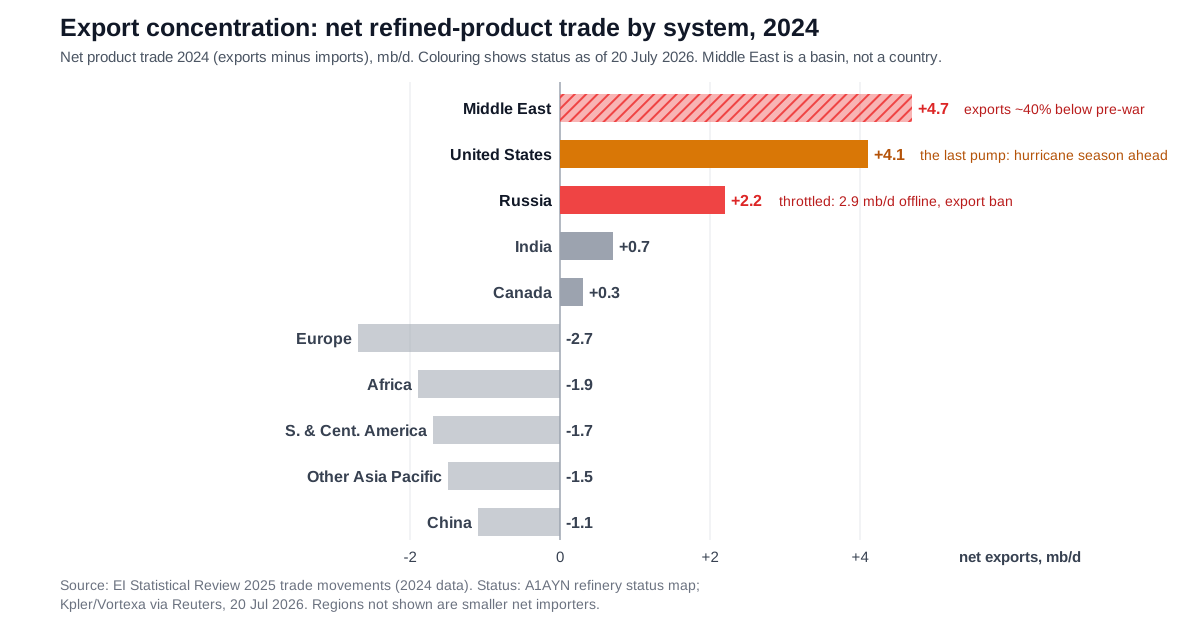
Refined products are mostly burned near where they are made. About 26 mb/d moved between the Energy Institute’s reporting regions in 2024, excluding trade within each region [4], and the net positions are concentrated in a way the capacity table never shows.
| Net product trade, 2024 | mb/d |
|---|---|
| United States | +4.1 |
| Middle East (Iraq, Kuwait, Saudi Arabia, UAE, other) | +4.7 |
| Russia | +2.2 |
| India | +0.7 |
| Canada | +0.3 |
| Europe | −2.7 |
| S. & Cent. America | −1.7 |
| Africa | −1.9 |
| China | −1.1 |
| Other Asia Pacific | −1.5 |
Product exports minus product imports, EI Statistical Review 2025 trade movements [4]. Regions not shown are smaller net importers.
Three export systems carry it: the Gulf, the United States and Russia, about 11 mb/d of combined net surplus. India and Canada add roughly 1 mb/d between them. Nearly everyone else buys. Setting “the Middle East” against two single states is a simplification, but the unit that matters is the export system, refineries plus terminals plus a shipping lane, not the flag over it.
Russia: the first pump
Ukrainian long-range drones have hit eight of Russia’s ten largest refineries. By late May, Reuters reported, no major refinery in European Russia had escaped attack [6][7]. Eleven facilities stood verified fully halted by mid-July, about 2.9 mb/d of distillation, with two more on reduced runs [13][16][26]. Omsk, the largest, was struck at a range of about 2,900 kilometres on 6 July [12]. Kirishi has lost three of its four crude units [6]. Moscow is not expected back before 2027 [15]. Saratov has been shut three times this year [14]. The repair crews are not working through a backlog; they are inside a campaign that keeps adding to it.
The cleanest evidence is on the water. Russia’s June seaborne diesel and gasoil exports fell 39% from May and 46% from a year earlier, to about 1.8 million tonnes, per Reuters calculations on Kpler shipping data [35].
How much refining is actually gone? The IEA says more than 20%. Kyiv’s General Staff says 42.7%. Both can be roughly right, because they measure different things: the first is closer to lost runs, the second matches the nameplate arithmetic of verified halts [5][26]. Nameplate is not throughput. A struck plant was not necessarily running flat out, unstruck plants absorb part of the loss, and only part of each lost barrel would have been exported anyway.
Russia processed about 5.5 mb/d of crude in 2024 and exported a net 2.2 mb/d of products [4]. Moscow serves its own market first, and said so on 8 July with a total diesel export ban [8]. What foreign buyers get is whatever remains of 2.2 after sustained losses:
| Reading | Sustained runs lost | Surplus left for export |
|---|---|---|
| IEA floor: idle plants absorb much of the hit | ~1.3 | ~0.9 |
| Central: verified halts at typical utilization, partial absorption | ~2.0 | ~0.2 |
| Attrition: re-strikes outrun repairs and absorption | 2.5 or more | zero, and a domestic gap |
mb/d, a deliberately rough forward mapping: sustained crude-run losses are treated as the ceiling on lost exportable product, while the real figure turns on yields, domestic demand and inventories, so read the rows as a direction and magnitude class, not a precise forecast. Surplus left = 2.2 [4] minus sustained runs lost, domestic demand served first.
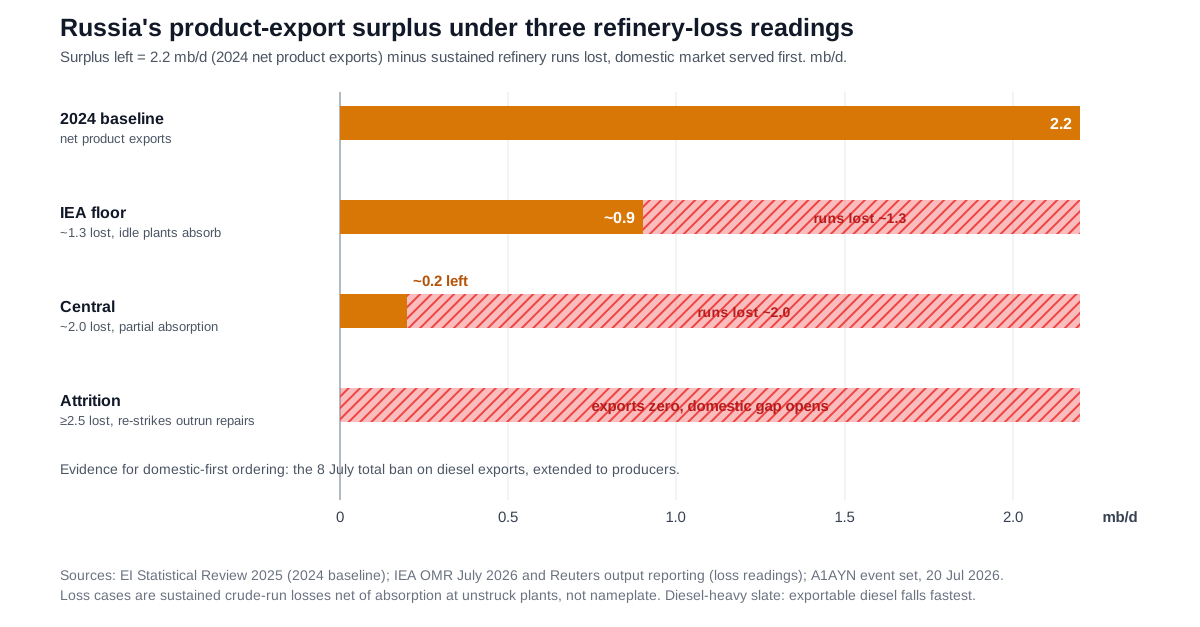
The optimistic case leaves less than half the old surplus. The central case leaves almost nothing. The attrition case leaves a domestic gap. And because the export slate is diesel-heavy while the strikes keep finding conversion units, exportable diesel falls faster than the average barrel.
The Gulf: the second pump
The Gulf is damaged at both ends, plants and route. More than 40 energy facilities across the Gulf and Iran are severely damaged, some with repair horizons of two years, on the IEA chief’s count [9]; the agency calls this the largest supply disruption in the history of the global oil market [10]; Rystad prices the damage at up to 58 billion dollars [11]. SATORP at Jubail, which used to send diesel and jet fuel to Europe in volume, took three drones in April, runs at about 70% and is not expected whole before early 2027 [20].
One comparison carries most of the story. By June, Gulf crude flows were back to nearly three-quarters of their February rate [17]. Refined-product and LPG exports were still below half their pre-war level, with key export refineries yet to resume loadings [5]. The crude found its way back to the water. The products did not.
The route is its own problem. Ras Tanura resumed loading in late June after four months of blockade [22]; commercial ships were attacked again in July when the truce collapsed [18][19]. A surviving refinery still has to sell into a strait that buyers, insurers and shipowners re-price week by week.
The United States: the third pump
Only the United States runs near normal scale: a net 4.1 mb/d of product exports in 2024, more than any other country, most of it loading on the Gulf Coast [4]. The platform is not untouched. Valero Port Arthur is still missing the diesel hydrotreater it lost to a March explosion, rebuild date unknown [24]. Hurricane season peaks in September. And Irving Saint John, the 300 kb/d plant that feeds New England’s tanks, goes dark from September to mid-November for that turnaround [1][2].
Anyone short of diesel this winter is, at the end of the chain, bidding against one American coastline in hurricane season.
Method: verified, assumed, stale
The refinery map behind these numbers tracks 35 curated facility events, each pinned to a dated source. A facility with no news renders as assumed operating, with the assumption stated as one. A verified outage stays in force until a restart is verified; silence is not recovery. Any status not reconfirmed within 90 days turns grey, stale and unverified, and drops out of the headline totals. In July that rule turned much of the Gulf grey until the entries were re-verified against fresh reporting, which is roughly what a decay rule is for.
The automated watcher that feeds the curation queue delivered its first lesson in humility early: in its first live week it accused a refinery in Normandy of a Canadian outage, because the word “Transport” contains the word “port”. The matcher was fixed. The incident stays on the record, as a reminder of what a status system publishes once it loses the ability to say “unverified”.
From 8 to 5: the bridge
Capacity affected and runs lost are different quantities. A damaged plant may have been running below nameplate before the strike, may keep some units working, may restart at reduced rate.
| War-affected category | Nameplate | Est. runs lost |
|---|---|---|
| Verified fully halted: Russia, 11 plants | 2.9 | ~2.5 |
| Verified fully halted: Iran, system-wide | 2.4 | ~2.1 |
| Verified run cuts: SATORP at 70%, two Russian plants, Singapore on substitute crudes | 1.8 | ~0.5 |
| Damaged and restarted, running with impairments: Ruwais, Mina Al-Ahmadi | 1.3 | ~0.2 |
| Total, without double counting | 8.3 | ~5.3 |
mb/d, from the map’s curated event set as of 20 July [26], Iran per the IEA [5]. Rows are rounded to one decimal independently, so by eye they add to 8.4; the 8.3 total is the sum of the unrounded values (8.33 mb/d). Runs-lost estimates assume struck Russian plants ran near 85% of nameplate before the war and Iranian plants near 90%; the assumptions are stated so they can be attacked. Venezuela’s roughly 1.1 mb/d of affected capacity is excluded: earthquakes, not war. Port Arthur and Chalmette are excluded on the same rule: industrial accidents. The ~5.3 is a July point-in-time reading at the affected plants, before counting the extra runs US, Chinese and Indian refiners have added against the shortfall [5].
The map keeps one more number, caveat attached. Inside its own fixed set of plants, the same spare-capacity arithmetic gave a gap of 8.3 mb/d in February, before the strikes, and 4.5 in July. The set is selected for being large or disrupted, not for being representative, so the level means little. The direction is the point: within one consistently measured set, apparent spare capacity has roughly halved in five months.
The sentence this brief will stand behind is the direct one: about 8% of world refining nameplate is affected, and roughly 5.3 mb/d of runs are currently lost.
The weather hedge
The strange comfort is that relief may come from weather rather than repairs. NOAA has El Niño at 97% odds of persisting into early spring 2027, and 81% odds of a very strong event in October to December [27]. Odds on the ocean are not odds on any particular thermostat, but they tilt several of the relevant risks in the same direction.
El Niño winters have tended to run milder across parts of northeast Asia. Japanese, Korean and Chinese heating demand is the marginal bid on Atlantic LNG cargoes, so a mild Asian winter loosens Europe’s gas balance at one remove. The same pattern can lean the northern United States milder, which matters most exactly where Irving’s turnaround, one long pipeline and a small tanker fleet meet: for a New England pensioner, a warm January means fewer visits from the oil truck.
El Niño’s wind shear also suppresses Atlantic hurricanes. NOAA forecasts a below-normal season, eight to fourteen named storms, one to three of them major [28]. That is an activity forecast, not a landfall forecast. One storm through the Texas-Louisiana corridor can hit diesel and LNG in the same afternoon.
Europe has little room for error either way. EU gas storage stood at 51.8% on 12 July, about 16 percentage points below the five-year norm [29]. The injection season began at 28%, a four-year low, and Brussels has already lowered the 1 November target from 90% to 80% [30]. Current injections are roughly enough for the lower target and no more. ACER puts the LNG imports needed for 90% at about 13% above 2025 levels; 80% looks reachable at last year’s rate [31], into a market where QatarEnergy holds force majeure into September and two LNG trains sit down for years [21]. Gas and diesel remain separate problems until a cold week pushes dual-fuel boilers and peaking plants onto gasoil. After that they are the same problem.
Two caveats keep the hedge honest. Mild is a tilt, not a promise: a February blocking event of the 2018 kind would land on 80% storage all the same. And strong El Niño impacts peak the year after the event. The Panama Canal authority is already assessing water restrictions for 2027 [32], and Asian drought would land on hydro and monsoons in 2027, the same year SATORP and the Moscow refinery are supposed to come back.
Three scenarios for winter 2026–27
An analyst reading of the alignment, not a quantitative forecast. Each scenario carries observable markers, so the reader can watch which one is coming true.
Scenario A: the repair race is won
The July truce collapse proves temporary. Gulf loadings normalize through the autumn, damaged plants ramp, Asian refiners lift runs as stranded crude clears. Russia stays impaired and the market absorbs what remains. Cracks retreat from records without returning to their 2024 range.
Watch for: Gulf refined-product and LPG exports climbing above half their pre-war level [5]; SATORP near nameplate; the verified-offline tally shrinking two months in a row [26]; European diesel cracks falling off their records on price transmission.
Scenario B: grinding attrition
Strikes continue at the current tempo. Russian repairs chase new hits and lose ground. Gulf recovery stalls on damage, insurance and buyer caution. Cracks stay high through the heating season, and the poorest importers ration by price, a pattern already visible in African and Latin American run rates. The mild El Niño tilt is the quiet subsidy that keeps this scenario from becoming the next one.
Nothing dramatic happens. Everything expensive persists.
This analyst’s base case.
Watch for: Gulf product exports stuck below half pre-war while crude flows recover [5]; a flat aggregate outage tally while the plant names rotate; EU storage reaching roughly 80% and stopping there [29].
Scenario C: the third pump stumbles
A September hurricane, or an ordinary bad week of the Port Arthur kind, lands on the Texas-Louisiana corridor while Irving is mid-turnaround. The US northeast, at the end of one long pipeline, a small Jones Act fleet and seaborne imports, rediscovers that its dedicated heating-oil reserve holds one million barrels [25]. Pressure for stock releases, shipping waivers and export limits builds within weeks, and the shortage moves to whichever foreign buyer was outbid last.
Low probability in any single week. The exposure window is five months long.
Watch for: a named storm tracking toward the Gulf Coast refining corridor [28]; a Colonial Pipeline or Gulf-port interruption; New England distillate inventories at multi-year lows; the first serious talk of export controls or a Jones Act waiver.
Implications
For EU buyers
Europe imported a net 2.7 mb/d of refined products in 2024 [4] and is now exposed in all three export systems at once. The post-2022 rerouting exercise assumed the destinations it rerouted to would stay intact. The useful question about a supply contract has moved down a level: not who the counterparty is, but which refinery the cargo leaves, over which terminal, through which strait. A supplier that cannot answer those questions has not looked.
For traders and transaction-risk desks
Facility status is now a dataset with a decay rate. An “operating normally” from April can be grey by July, and this year it was, twice. Underwriting or financing against an operating claim without a verification date is underwriting a rumour.
For policymakers
IEA members hold 90 days of net oil imports as emergency stocks, crude or products, composition their own choice [36]. The United States holds hundreds of millions of barrels of crude and one million barrels of northeast heating oil [25]. The whole emergency kit was designed in the 1970s, for a crude shortage. Crude is the product the world still has enough of. The households priced out this winter will be short of diesel.
References
[1] Bloomberg, “Canadian oil refinery shutdown could crimp northeast US supply” (17 July 2026). Irving Saint John turnaround as a northeast US supply risk. https://www.bloomberg.com/news/articles/2026-07-17/canadian-oil-refinery-shut-down-could-crimp-northeast-us-supply
[2] Hydrocarbon Processing (Reuters), “Irving Oil’s refinery in Saint John, New Brunswick, to begin fall turnaround in September” (July 2026). Turnaround timing, September to mid-November. http://www.hydrocarbonprocessing.com/news/2026/07/irving-oils-refinery-in-saint-john-new-brunswick-to-begin-fall-turnaround-in-september/
[3] US EIA, Gasoline and Diesel Fuel Update (20 July 2026). US regular gasoline 4.001 USD/gal, on-highway diesel 5.134 USD/gal, week of 20 July 2026. https://www.eia.gov/petroleum/gasdiesel/
[4] Energy Institute, Statistical Review of World Energy 2025. World and regional refining capacity, refinery throughput, oil trade movements including product imports and exports by region; 2024 data. https://www.energyinst.org/statistical-review
[5] IEA, Oil Market Report, July 2026. Global runs, Russian refining out of action, Iranian system status, Singapore run cuts, Gulf export refinery loadings. https://www.iea.org/reports/oil-market-report-july-2026
[6] Meduza, “Ukrainian drones have struck nearly every major Russian refinery. Which facilities have yet to be hit?” (29 June 2026). Eight of the ten largest plants struck; facility-by-facility status including Kirishi crude units. https://meduza.io/en/feature/2026/06/29/ukrainian-drones-have-struck-nearly-every-major-russian-refinery-which-facilities-have-yet-to-be-hit
[7] The Moscow Times (Reuters), “Drone strikes force central Russian refineries to halt or cut output” (20 May 2026). Reuters reporting: by late May no major refinery in European Russia had escaped attack. https://www.themoscowtimes.com/2026/05/20/drone-strikes-force-central-russian-refineries-to-halt-or-cut-output-reuters-a92805
[8] The Moscow Times, “Russia bans diesel exports to ensure domestic supply after targeted Ukrainian drone strikes” (8 July 2026). Total diesel export ban extended to producers (also reported by TASS and Reuters); gasoline output down roughly a quarter year on year per Reuters. https://www.themoscowtimes.com/2026/07/08/russia-bans-diesel-exports-to-ensure-domestic-supply-after-targeted-ukrainian-drone-strikes-a93202
[9] CNBC, “More than 40 Middle East energy assets ‘severely damaged,’ IEA chief says” (23 March 2026). Fatih Birol on severe damage and repair horizons of up to two years. https://www.cnbc.com/2026/03/23/iran-war-energy-oil-gas-middle-east-iea-us-uae-qatar.html
[10] IEA, Oil Market Report, April 2026 (14 April 2026). “Largest supply disruption in the history of the global oil market”; stock releases and supply-crunch assessment. https://iea.blob.core.windows.net/assets/515f3128-df1a-4d6c-beb4-fd91d2434bef/-14APR2026_OilMarketReport_Free_version1.pdf
[11] CNBC, “Iran war damaged as much as $58 billion of energy infrastructure, Rystad estimates” (15 April 2026). https://www.cnbc.com/2026/04/15/iran-war-energy-facilities-refinery-pipeline-lng.html
[12] The Moscow Times, “Ukraine strikes Russia’s largest oil refinery in Western Siberia” (6 July 2026). Omsk strike and halt. https://www.themoscowtimes.com/2026/07/06/ukraine-strikes-russias-largest-oil-refinery-in-western-siberia-a93177
[13] Meduza, “Gazprom Neftekhim Salavat handles 2.7 percent of Russia’s oil refining; a single overnight drone attack took it offline” (15 July 2026). https://meduza.io/en/news/2026/07/15/gazprom-neftekhim-salavat-handles-2-7-percent-of-russia-s-oil-refining-a-single-overnight-drone-attack-took-it-offline
[14] Meduza, “For the third time this year, a Ukrainian drone strike shuts down Rosneft’s Saratov oil refinery” (9 July 2026). The re-strike pattern in one plant. https://meduza.io/en/news/2026/07/09/for-the-third-time-this-year-a-ukrainian-drone-strike-shuts-down-rosneft-s-saratov-oil-refinery
[15] The Kyiv Independent, “Moscow oil refinery unlikely to resume operations this year after Ukrainian drone attacks” (24 June 2026). https://kyivindependent.com/moscow-oil-refinery-unlikely-to-resume-operations-this-year-after-ukrainian-drone-attacks/
[16] CNN, “Russia’s Tuapse oil refinery strikes and pollution” (30 April 2026). Tuapse halt and spill. https://www.cnn.com/2026/04/30/europe/russia-tuapse-oil-refinery-strikes-pollution-intl-cmd
[17] BOE Report (Reuters), “Gulf oil exports jump in June on record UAE flows” (3 July 2026). Kpler: five-producer seaborne crude and condensate exports ~10.1 mb/d in June, up from ~7 in May; Vortexa: ~10.2 against 16.5 a year earlier. https://boereport.com/2026/07/03/gulf-oil-exports-jump-in-june-on-record-uae-flows/
[18] Al Jazeera, “Ships attacked in the Strait of Hormuz: What that means for ongoing talks” (7 July 2026). Truce collapse and attacks on commercial shipping. https://www.aljazeera.com/news/2026/7/7/ships-attacked-in-the-strait-of-hormuz-what-that-means-for-ongoing-talks
[19] CNN live coverage, “US resumes strikes while Iran says it struck two tankers in Strait of Hormuz” (13 July 2026). Tankers struck 12 July; US strikes resumed 13 July. https://www.cnn.com/2026/07/13/world/live-news/iran-war-trump
[20] Hydrocarbon Processing (Reuters), “TotalEnergies’ Saudi Arabia refinery will not be fully repaired until early 2027, CEO says” (June 2026). Pouyanné: SATORP at 70% after three drone hits in April; prior diesel and jet exports to Europe. https://www.hydrocarbonprocessing.com/news/2026/06/totalenergies-saudi-arabia-refinery-will-not-be-fully-repaired-until-early-2027-ceo-says/
[21] CNBC, “QatarEnergy extends force majeure to September” (1 July 2026). Ras Laffan trains and repair horizon. https://www.cnbc.com/2026/07/01/qatarenergy-extend-force-majeure-september-italys-edison-iran-war-.html
[22] CNBC, “Saudi Aramco resumes oil loading at Ras Tanura in boost to supply” (27 June 2026). https://www.cnbc.com/2026/06/27/saudi-aramco-resumes-oil-loading-at-ras-tanura-in-boost-to-supply.html
[23] Hydrocarbon Processing, “Venezuela’s largest refinery in service after power outage following earthquake” (3 July 2026). Amuay restart at ~140 kb/d. http://www.hydrocarbonprocessing.com/news/2026/07/venezuelas-largest-refinery-in-service-after-power-outage-following-earthquake/
[24] Oil & Gas Journal, “Valero’s Port Arthur refinery faces uncertain timeline for diesel hydrotreater rebuild” (30 April 2026). Throughput largely recovered; the diesel hydrotreater is the open item. https://www.ogj.com/refining-processing/refining/operations/news/55374647/valeros-port-arthur-refinery-faces-uncertain-timeline-for-diesel-hydrotreater-rebuild
[25] US Department of Energy, “Northeast Home Heating Oil Reserve”. One-million-barrel reserve description. https://www.energy.gov/ceser/northeast-home-heating-oil-reserve
[26] A1AYN, Global Refinery Status. The curated event set, decay methodology, capacity tally and regional runs behind this brief; a downloadable facility-level ledger is being added. https://a1ayn.com/data/refineries/
[27] NOAA Climate Prediction Center, ENSO Diagnostic Discussion (9 July 2026). 97% chance El Niño persists into early spring 2027; 81% chance of a very strong event in October-December. https://www.cpc.ncep.noaa.gov/products/analysis_monitoring/enso_advisory/ensodisc.shtml
[28] NOAA, “NOAA predicts below-normal 2026 Atlantic hurricane season” (May 2026). 8-14 named storms, 1-3 major, 70% confidence; El Niño shear mechanism; not a landfall forecast. https://www.noaa.gov/news-release/noaa-predicts-below-normal-2026-atlantic-hurricane-season
[29] GIE AGSI+ transparency platform (reading of 12 July 2026). EU storage 51.8% full (586 TWh), about 16 percentage points below the five-year norm; injections ~0.26 points/day. https://agsi.gie.eu/
[30] Euronews, “EU faces tougher gas storage refill task as winter looms and high prices bite” (8 July 2026). The 28% four-year-low starting point and the relaxed 80% target. https://www.euronews.com/my-europe/2026/07/08/eu-faces-tougher-gas-storage-refill-task-as-winter-looms-and-high-prices-bite
[31] ACER, “The EU will need higher LNG imports to refill gas storage ahead of winter” (2026). The +13% LNG import requirement. https://www.acer.europa.eu/news/eu-will-need-higher-lng-imports-refill-gas-storage-ahead-winter
[32] Argus Media, “Panama Canal sees El Niño slowing transits next year” (4 June 2026). 2027 water-management assessment. https://www.argusmedia.com/en/news-and-insights/latest-market-news/2835586-panama-canal-sees-el-nino-slowing-transits-next-year
[33] CNBC, “The UAE’s departure from the OPEC oil cartel is not without precedent. Who could be next?” (29 April 2026). UAE exit from OPEC+ (effective 1 May) against a backdrop of slipping quota discipline (Kazakhstan, Iraq). https://www.cnbc.com/2026/04/29/uae-opec-exit-oil-iran-war.html
[34] Al Jazeera, “OPEC+ announces symbolic oil output rise during Strait of Hormuz closure” (3 May 2026). The symbolic May quota rise; spare capacity trapped behind the Gulf blockade left members unable to lift output. https://www.aljazeera.com/news/2026/5/3/opec-announces-symbolic-oil-output-rise-during-strait-of-hormuz-closure
[35] CREA, “June 2026 monthly analysis of Russian fossil fuel exports and sanctions” (July 2026). Independent tracking of the collapse in Russian refined-product exports; the specific June seaborne diesel and gasoil figures (down 39% m/m, 46% y/y, to ~1.8 Mt) are Reuters calculations on Kpler shipping data. https://energyandcleanair.org/june-2026-monthly-analysis-of-russian-fossil-fuel-exports-and-sanctions/
[36] IEA, “Oil security” (emergency stockholding). Members hold 90 days of net oil imports, as crude or products; composition varies by country. https://www.iea.org/topics/oil-security
Data note: world and regional refining figures are 2024 calendar-year values from the EI Statistical Review 2025. The 2026 edition, released 30 June with 2025 data, is deliberately not used for the baseline: the drone campaign against Russian refining ran through 2025, so 2025 is already a war year, and 2024 is the last calendar year clean of both wars, which is what a baseline is for. Facility statuses are as verified on 20 July 2026 under the status map’s decay rule: statuses not re-verified within 90 days drop from headline totals rather than being assumed. The 8.3 mb/d capacity-affected figure and the ~5.3 mb/d runs-lost estimate are bridged in the table above; both combine the map’s verified set with market reporting and are mid-range readings, not floors or ceilings. The Russian export sensitivity is a three-case band, not a forecast; its assumptions are printed with it. ENSO probabilities, storage fill levels and the hurricane outlook are as published in mid-July 2026; the El Niño reading of European winter weather is low-confidence by the nature of that teleconnection, and is labelled a tail, not a forecast.