With the rest of the world I have watched with horror how the world’s refining capacity is taken out in flames. This has situated most countries between a rock and a hard place. Naturally one wants to take a deeper look at dear home Thailand, and at the strategic space it has to manoeuvre in these turbulent times. What ties Thailand to those flames is gas: 56% of its electricity over the 12 months to May 2026 [25], with the growth in that gas arriving by ship. That is the deepest lens I take in this overview.
In May 2026 Thailand burned 5,470 million standard cubic feet of gas a day. Of that, 3,095 mmscfd came from its own fields in the Gulf of Thailand and 412 mmscfd crossed the western border through three pipelines from Myanmar. The remaining, approximately 1,962 mmscfd, was landed at Thai terminals as LNG, bought on the world market.
The LNG cost THB 102.7 billion in the first five months of 2026, about USD 3.2 billion, 8% more than in the same months of 2025 and already 56% of what Thailand paid for LNG in the whole of last year [1][29]. Thai power stations take 61% of the country’s gas over the same 12 months, so that cost lands on households and factories through the Ft charge on their electricity bills [1][15].
Thailand buys that LNG because in the short run it cannot burn anything else. The money is committed: about 40,300 MW of gas-fired capacity is running, the newest 3,555 MW of it brought online between March 2023 and January 2025, and seven privately owned plants, over 11 GW between them, were paid through a year in which they produced less than a tenth of the electricity they could have [12][14][31]. Nothing else can take much of that load within a year or two. Hydro depends on how much it rains. Imported electricity is limited by the transmission links already in place. Coal has spare capacity, but burning more of it emits more carbon and worsens urban air quality, and Thailand has committed to cutting net emissions 47% from 2019 levels by 2035 [44]. So when demand rises, or a field in the Gulf produces less, the extra gas comes in as LNG. Over the first five months of 2026 that cost 382 baht per MMBtu, about USD 11.97, against 299 baht or USD 9.37 for the same energy through the Myanmar pipelines: this brief’s arithmetic, dividing EPPO’s published import values by its published import volumes [1][24][29].
Apart from burning less gas, which is what Thailand did in 2022, the alternatives to imported LNG are three: its own fields, the Myanmar pipelines, and the seabed Thailand and Cambodia both claim.
Pailin is operated by PTTEP with 60% and Chevron Thailand with 40%, and their concession runs out in 2028 [3]. The Department of Mineral Fuels can extend it by ten years if the holders want to stay, or put the block out to auction, which is what it did at Erawan in 2018; that handover was delayed by a decommissioning dispute and the field ran below its contracted output for two years [2].
Yadana, the Myanmar line carrying almost all of the pipeline decline, has already changed hands once. TotalEnergies announced its withdrawal in January 2022, the exit took effect in July 2022, and PTTEP International took over as operator the same day, keeping the field in production [21][22][45]. Chevron transferred its 41.1% on 1 April 2024, which left PTTEP holding 62.963% alongside Myanmar’s state oil company, Myanma Oil and Gas Enterprise [23]. Gas from these operations matters on both sides of the border: PTTEP’s chief executive has said they generate the equivalent of about half of Myanmar’s electricity consumption [23]. The export contract into Thailand ends in 2028, and PTTEP has said it is considering an extension [23].
The third source is, so far, theoretical. Thailand and Cambodia both claim an area of seabed in the Gulf of Thailand, immediately next to the fields Thailand already produces from. The countries signed a framework to develop it jointly in 2001, and in the twenty-five years since, neither government has been able to award a licence [7]. Even if an agreement satisfying both sides were reached, years of exploration, appraisal and development would come before any gas flowed.
Live Thai supply by field and by import source sits at /data/pipelines/, and the reservoir and El Niño layer at /data/water/, both refreshed on a schedule.
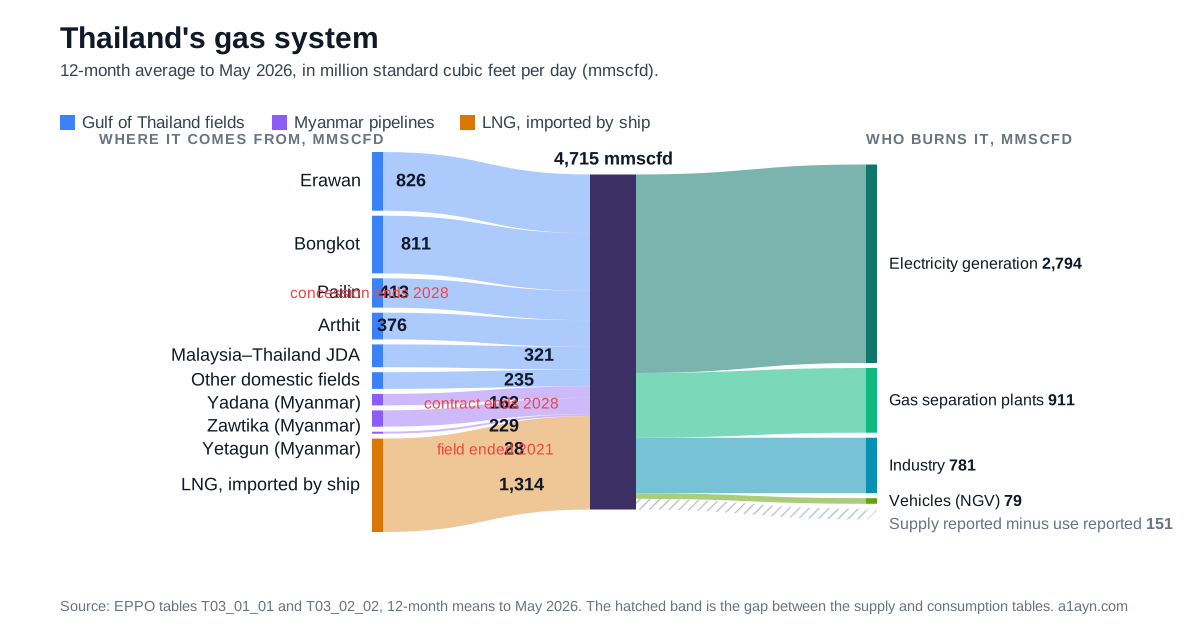
Two of the ten carry a 2028 date: Pailin’s concession and Yadana’s export contract. Yetagun ended in 2021 and is drawn at its remaining 28 mmscfd because the pipeline still delivers that much.
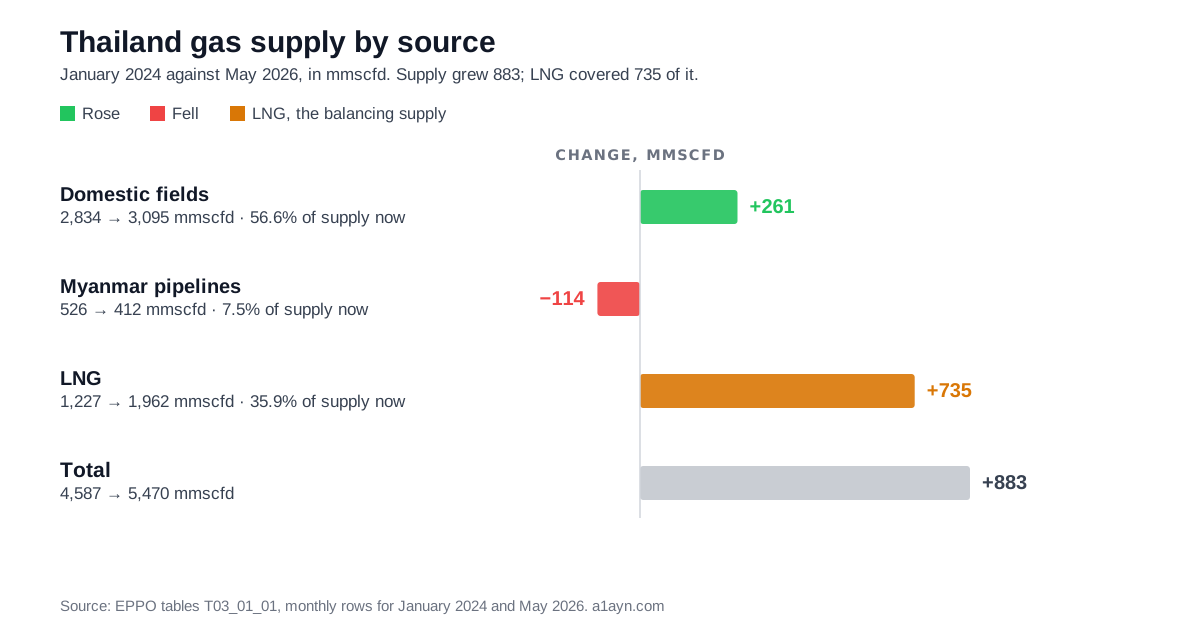
Thailand gas supply by source, January 2024 and May 2026 (mmscfd) [1]
Total supply grew 883 mmscfd between January 2024 and May 2026. Thai fields covered 261 mmscfd of the growth, and the Myanmar pipelines delivered 114 mmscfd less, a combined gap of 736 mmscfd. The gap was recovered with LNG, which rose by approximately the same amount: 735 mmscfd. The pressures behind that gap continue: several of the mature Gulf fields are in decline, Pailin’s concession and Yadana’s export contract both end in 2028, and the contested seabed is undrilled. That points towards more LNG, the most expensive gas Thailand imports.
A look at domestic production
Thailand’s fields produced 3,204 mmscfd in 2021 and 2,936 mmscfd in 2025, while LNG imports rose 401 mmscfd over the same years [1].
Erawan, the largest field in the Gulf, fell from 867 mmscfd to 311 mmscfd in 2022, when Chevron’s concession ended and PTTEP took over under a production-sharing contract it had won at auction in December 2018 [1][2]. Platforms pass to the Thai state at the end of a concession and have to be dismantled eventually. Chevron and the Department of Mineral Fuels disagreed over who paid, PTTEP could not get onto the assets it had won, and Erawan stayed below its contracted output until April 2024 [2]. The disagreement was unfortunate and it cost both PTTEP and consumers.
PTTEP has shown operational excellence, but a well in decline is an uphill battle. The Bongkot complex fell 162 mmscfd between 2021 and 2025, and the Malaysia-Thailand JDA 103 mmscfd over the same years, 77 mmscfd of it in the single step from 2023 to 2024 [1].
What Thailand did in 2022 shows how little room it had: it did not replace the missing gas. Total supply fell from 4,726 mmscfd to 4,246 mmscfd, down 10%, while LNG imports rose 113 mmscfd [1]. European buyers were bidding cargoes away from Asia after Russia’s invasion of Ukraine [18].
Thai electricity demand in 2022 ran above its pre-COVID level [38]. Gas into the separation plants fell 14% and into power generation 6%, while hydro generation rose by nearly half, oil-fired generation doubled from a low base and industrial gas use rose [1][38]. The separation plants run on wet gas from the Gulf, stripping out ethane, propane and LPG before the methane moves on as fuel: the ethane and propane feed the Map Ta Phut petrochemical complex and the LPG goes to household cooking and vehicles [39]. The deepest cut fell on petrochemical feedstock, and PTTGC, whose crackers take the ethane and propane, closed 2022 with a net loss of THB 8.8 billion, USD 0.25 billion, a result that also carried a much larger hedging loss [40].
A year later Thailand replaced the 2022 loss with more of the expensive LNG: imports rose 513 mmscfd in 2023 [1], worth THB 282.5 billion, USD 8.1 billion, over the year [24][29].
Pailin is the next field to change hands, in 2028. It averaged 415 mmscfd over the 29 months of EPPO data to May 2026, 8.7% of national supply [1][3]. The Department of Mineral Fuels can extend by ten years, but only if both holders want to stay [3]. The same kind of decommissioning question will need settling at Pailin’s handover, and hopefully before 2028 rather than during it.
Added 4 August 2026: In July 2026 Chevron completed the Gulf of Thailand’s first reuse of an entire wellhead platform, topside and jacket together, moved from a decommissioned site to its new Chaba B location with the Department of Mineral Fuels’ approval; Chevron puts the saving at about 4,280 tonnes of CO2 equivalent against dismantling and building new, and says reuse makes smaller Gulf fields viable to develop [46].
A repeat would take about 400 mmscfd out, and 2028 is a harder year to lose it in than 2022 was. Two contracts end in 2028 rather than one, Pailin’s concession and Yadana’s export agreement, about 565 mmscfd between them, and 36% of Thai gas now arrives by sea against 27% at the start of 2024 [1].
Deferring production is not the same as losing it. The gas is still in the reservoir and Erawan is producing 855 mmscfd today. The common-sense case for leaving it there is a good one: fossil-fuel prices rise over the long run, so gas produced later sells for more, and buying at market prices in the meantime is the cost of holding an asset that is gaining value. Instability is what makes that case hard to judge here, and a commitment to cut net emissions 47% from 2019 levels by 2035 leaves a smaller home market to sell it into [44].
The Myanmar pipelines
The aggregate for Myanmar is 412 mmscfd and falling.
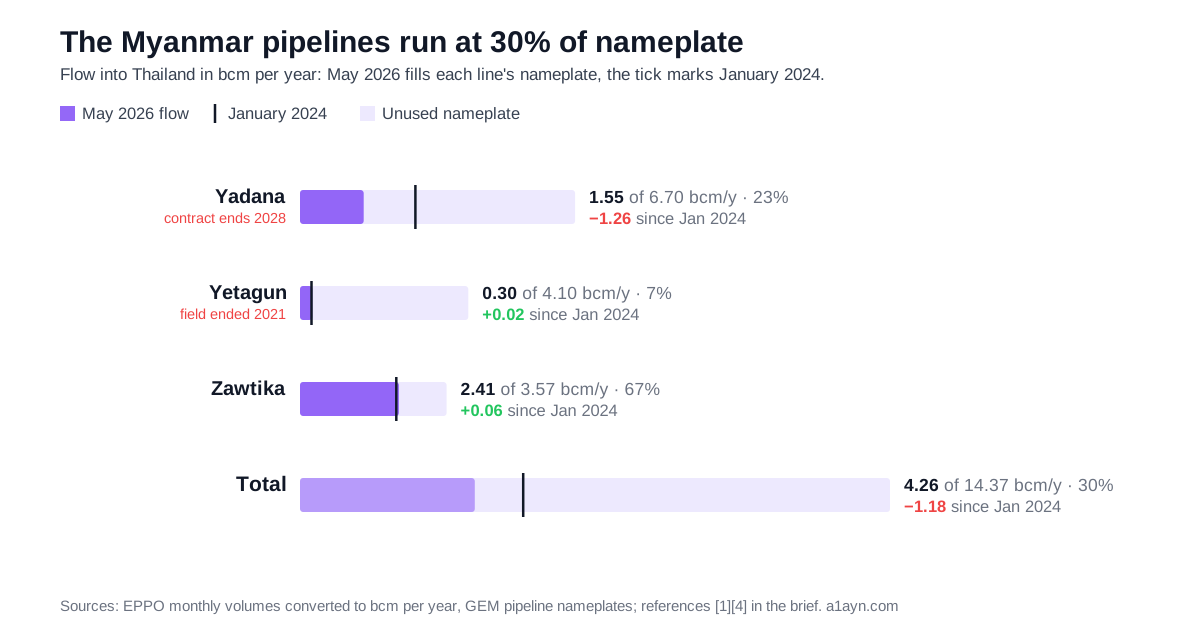
Myanmar pipeline flows into Thailand against operating nameplate (bcm/y) [1][4]
Yetagun’s field depleted: production ceased in April 2021, apart from a brief restart later that year [5]. Petronas’ subsidiaries announced their withdrawal from the Yetagun blocks in April 2022, and Japan’s ENEOS followed in May [5]. What trickles across the border now is 28 mmscfd through a line built for 4.1 bcm a year, and it has been that way for five years.
Zawtika has held around two thirds of nameplate across the whole period, and keeping it there is active work: PTTEP completed its Phase 1D development wells and installed four new wellhead platforms under Phase 1E between September 2025 and February 2026 [6][23]. Zawtika also faces no 2028 deadline: PTTEP puts its contract at roughly another two decades [23].
That leaves Yadana carrying the entire decline.
Yadana delivered 434 mmscfd to Thailand in 2021 and 428 mmscfd in 2022, then 287 mmscfd in 2023, 247 mmscfd in 2024, 174 mmscfd in 2025 and 150 mmscfd in May 2026 [1]. Sixty percent gone in the four years to 2025, 65% by May 2026, and the break falls in 2023, the year after TotalEnergies left.
Yadana’s production is falling more slowly than its deliveries to Thailand. PTTEP reported production of 443 mmscfd for 2024, and EPPO recorded 247 mmscfd of it arriving in Thailand, which is 56% of the field’s output [1][23]. The long-standing arrangement was 80% to Thailand and 20% to MOGE for Myanmar’s domestic market [5].
PTTEP still holds 63% of Yadana, and in December 2024 it told the Thai stock exchange it would drill another well there during 2025 to hold production and extend the field’s life [23].
The pipes are not the constraint: at 30% of nameplate they could carry more than three times today’s flow. The fields are. One is dead, one is held level by continuous drilling, and the largest is falling, with its export contract ending in 2028. It seems unlikely that Myanmar could provide more gas to Thailand’s current or future needs; holding today’s 412 mmscfd is the ambitious case, and it depends on a renewal that has not happened [1][23].
It seems unlikely that Myanmar could provide more gas for Thailand’s current or future energy needs.
What the LNG costs
EPPO publishes the bill as well as the volume, in table 6.1-3 [24]. LNG and pipeline gas are separate lines in it, so the seaborne cost can be read on its own.
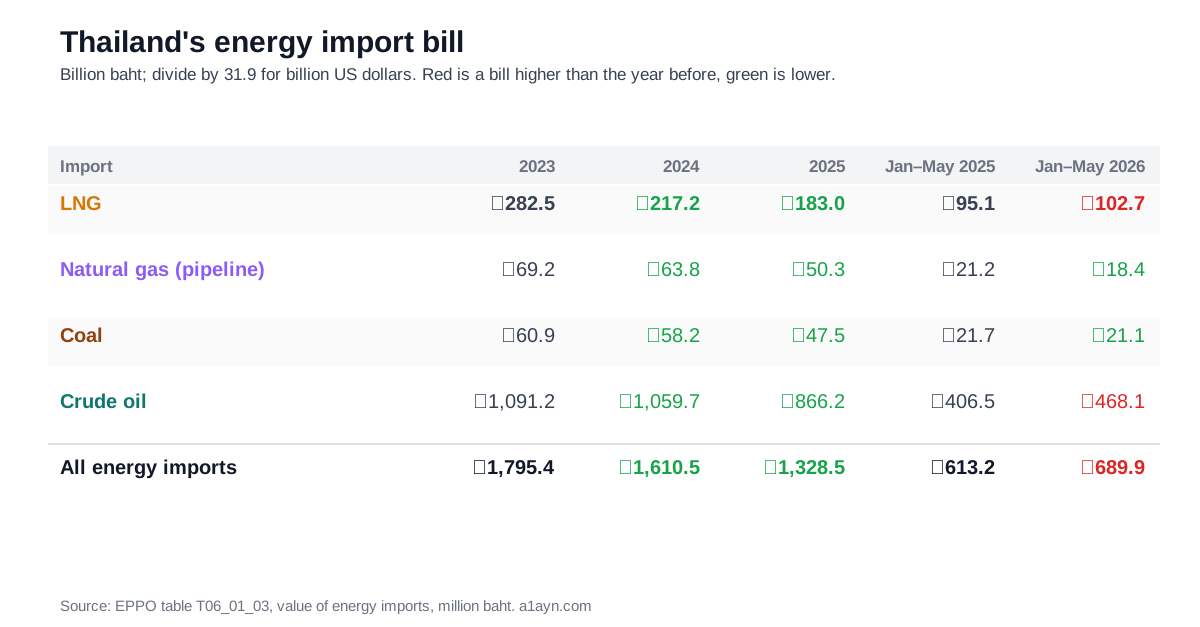
Thailand’s energy import bill, LNG against the alternatives (billion baht; divide by 31.9 for billion US dollars) [24][29]
LNG is 14.9% of Thailand’s energy import bill, an energy expenditure second only to crude oil. Every other line of the bill fell between 2023 and 2025 and LNG fell with them, from THB 282.5 billion to THB 183.0 billion, or USD 8.9 billion down to 5.7 billion. Then 2026 turned: the LNG bill is up 8.0% in five months while pipeline gas is down 13.3%.
Turning those baht into a price per unit of energy needs one more number: the heating value, how much energy a cubic foot of gas carries. EPPO prints exactly one, 1,000 BTU per standard cubic foot, and only for Myanmar pipeline gas; for LNG it prints none [1]. The gap can be filled from Thailand’s other reporting line, because the same imports are filed to JODI in energy units. Set against EPPO’s volumes, the two series move together almost perfectly, with month-on-month changes correlating at r = 0.995 across 29 overlapping months, but JODI’s energy runs a constant 10% above EPPO’s volumes converted at 1,000 BTU/scf [1][16].
A constant 10% gap has two possible causes, and they leave identical marks in the data. Either Thai LNG really carries about 1,100 BTU/scf, a richer gas than Myanmar’s, so converting it at 1,000 BTU/scf understates its energy by a tenth; or the two reporting chains state energy on different conventions, since the gross and net calorific values of the same gas also differ by roughly 10%. The numbers cannot tell these apart. This brief uses 1,100 BTU/scf for LNG and shows the 1,000 BTU/scf figure beside it, so the qualitative conclusion, that LNG costs more than pipeline gas, does not depend on the choice; the precise premium does.
Whichever basis is right, LNG costs Thailand more per unit of energy than pipeline gas. Dividing EPPO’s import values by the volumes it reports for the same months: pipeline gas cost THB 299 per MMBtu, and LNG cost THB 382 on the 1,100 BTU/scf calibration or THB 420 on EPPO’s printed 1,000 BTU/scf, a premium of approximately 28% to 40% [1][24]. In dollars at the January-to-May average of 31.91 baht, that is USD 9.37 for pipeline gas against USD 11.97 to 13.16 for LNG [29]. The regulator’s own gas-cost assumption for September to December, across all sources, is 363.53 baht per MMBtu, about USD 11.39, which lands between this arithmetic’s pipeline and LNG figures [26].
In the United States, which produces much of the world’s new LNG, gas averaged USD 4.02 per MMBtu from January to May, a price inside the American pipeline system, before liquefaction, the ship and its insurance [28]. Thailand’s USD 11.97 to 13.16 is measured at the other end of that chain, the value of cargoes arriving at Thai terminals [24]. The chain in between, and Asian buyers’ competition for the cargoes, turns the one price into the other.
The like-for-like comparison is Japan, whose LNG imports over the same five months averaged USD 12.55 per MMBtu on the same measure, import value over import volume [30]. Thailand’s range brackets Japan’s average: this is what delivered gas costs in Asia, roughly three times what it costs in the country that ships it. And by July the spot market had moved past all of it: above USD 19 per MMBtu for September delivery, more than double what the market had expected for 2026 at the start of the year [18].
The THB 102.7 billion for January to May, USD 3.2 billion, was paid at prices well below where spot now trades. The same five months of cargoes at July’s spot price would have cost about THB 163 billion, or USD 5.1 billion: the volumes actually shipped, repriced at USD 19 per MMBtu and converted at the same 31.91 baht [1][18][29].
Simply, gas is already expensive, and the evidence points towards chilling hikes.
The gas Thailand and Cambodia both claim
In 2026 the standoff turned into a legal process with a deadline. The framework for developing the area jointly, the 2001 memorandum Thailand calls MOU 44, was revoked by Prime Minister Anutin Charnvirakul’s cabinet on 5 May, on the stated grounds that twenty-five years had produced nothing [7]. Cambodia responded on 2 June with a notification of compulsory conciliation under Annex V of the UN Convention on the Law of the Sea [7]. Thailand accepted the process on 19 June, appointed Deputy Prime Minister and Foreign Minister Sihasak Phuangketkeow as its Agent, and stated that the outcome is not binding and that the scope should cover boundary delimitation only [8]. The commission has 12 months to report.
What a report could deliver is a boundary, and a boundary is not gas. The public record holds no audited reserve figure, no declared commercial discovery, no appraisal programme and no cost estimate for the area; the numbers in circulation trace back to survey work from the early 2000s and differ from each other by about a fifth.
The one precedent is Timor-Leste and Australia. Timor-Leste brought Australia into compulsory conciliation in 2016, the first use of the mechanism, and within two years the two states signed a maritime boundary treaty covering the Greater Sunrise gas fields [9]. The treaty settled who owns the gas. It left open where the gas would be processed, and it wrote Timor-Leste’s revenue share as two numbers, seventy or eighty per cent, “depending on where the resource is developed” [9]. Eight years later that choice is still open, and the gas is still in the seabed.
Water, hydro and the El Niño
In the first five months of 2026 hydro generation ran 34% above the same months of 2025, the fastest growth of any source in the dispatch data [25]. A gigawatt-hour of hydro is a gigawatt-hour of thermal generation not run, and in the hours when gas sets the margin, gas not burned is LNG not bought.
Thailand operates 3,930 MW of hydro, which is the gas-substitution ceiling, against about 40,300 MW of gas plant; the hydro additions on EGAT’s development list are four downstream units totalling under 7 MW [12][35][37]. January to May 2026 was hydro’s strongest start to a year in the three years of data: 4.7% of the country’s electricity, against 61% from gas [12][25]. Set aside the 1,000 MW of pumped storage, which shifts energy between hours rather than adding it, and the 2,930 MW of conventional turbines ran at about 44% of their theoretical maximum; even flat out around the clock, they could roughly double that 4.7%. The gas hydro displaces is the last gas Thailand buys, and the last gas Thailand buys is what we now know to be an expensive spot cargo.
Thai large dams held 44,024 million cubic metres against 87,988 million cubic metres of capacity on 30 July 2026, which is 50.0% full. The two operators hold different portfolios in different basins, so they never read alike, but the gap is wide: EGAT’s hydro reservoirs are 53.4% full against the Royal Irrigation Department’s 37.3% [10]. One daily reading is a starting point rather than a drought. Thirteen of the 41 reservoirs sit below a quarter full, including Ubolratana, a 4,640 million cubic metre EGAT reservoir in the Northeast, at 16.9%.
Water is a cheap source of electricity, and therefore, when there is plenty of it, the power producer is happy to run it; but the 41 large dams are operated by a power utility and an irrigation department together, and a release serves flood control, dry-season storage and the farmers’ irrigation calendar as well as the turbines [10]. The chance to produce hydro seems limited in El Niño times, and mostly with a year’s delay: across 2000 to 2025 the ENSO index and Thai hydro output move opposite ways, weakly in the same year and more clearly the year after, r of −0.23 and −0.46, this brief’s arithmetic [11][38].
NOAA’s Climate Prediction Center says El Niño conditions are present and expects them to strengthen, putting the chance they persist into early 2027 at 97% [27]. Its Oceanic Niño Index reads +1.0°C for April to June 2026 [11]. The five-consecutive-season rule that this site uses to date past episodes is a retrospective classification and not a precondition for the operational call.
Milder winters in Japan and Korea, the two buyers Thailand competes with for spot cargoes, might ease the spot price. The Thai side of the same conditions is more certain: hotter and drier weather raises cooling load and lowers reservoir inflow into dams at half [10]. Price relief is a maybe; higher Thai volume is the likely path.
If the water does run short, this year’s substitution runs in reverse, and the fallback with the deepest exposure to world prices is gas: electricity took 3,253 mmscfd of the 5,079 mmscfd Thailand consumed in May 2026, or 64.0% [1].
Electricity capacity: built, building, shelved
Here is the full lifecycle picture, rebuilt category by category, with GEM checked against Ember, EGAT and the operators.
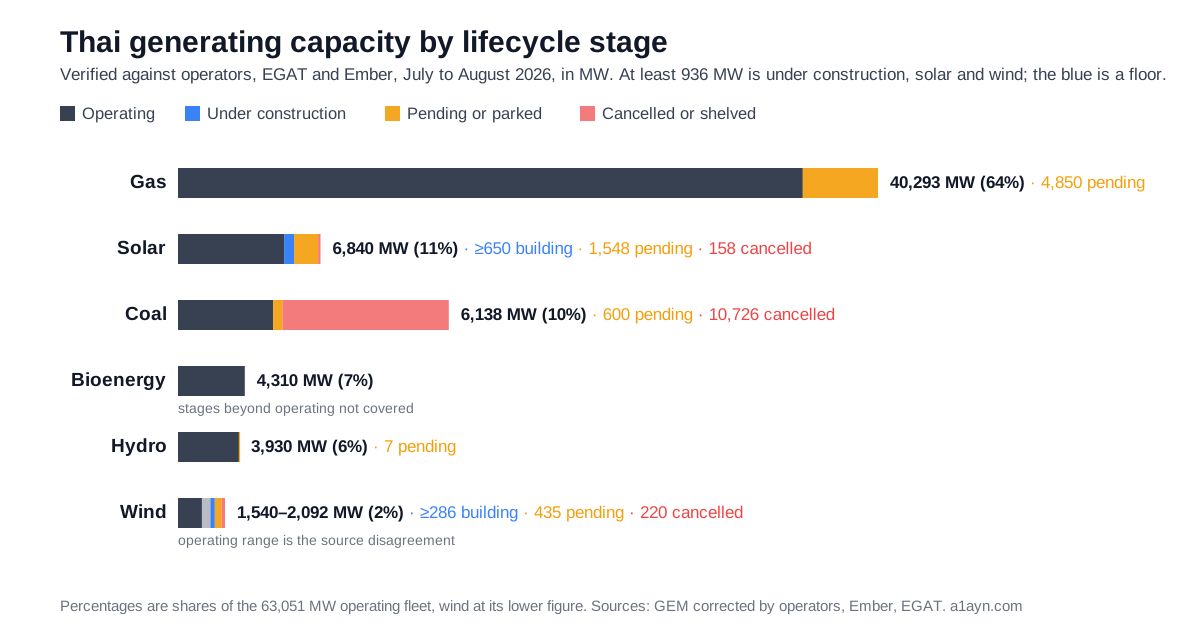
Thai generating capacity by lifecycle stage, verified, July to August 2026 (MW) [12][13][31][32][33][34][35][36][37][38][41][42]
The stages the brief leans on hold up: gas and coal operating agree across GEM and Ember within 5%, and hydro agrees across three sources once pumped storage is separated. Solar is the opposite: Ember records Thai capacity jumping from 3,390 MW to 6,840 MW during 2025, the small-producer wave arriving in national statistics, while GEM’s tracker still shows 1,041 MW and no construction [34][38]. And the solar construction figure is a floor, not a total: 623 MW is what Gulf alone disclosed, and no list of the other builders’ sites exists in any source used here. Bioenergy is in the picture from Ember alone: 4,310 MW operating, the fourth-largest segment, peaked at 4,500 MW in 2022 [38]. Wind’s operating range is the sources’ disagreement, a third apart [12][38], but its construction is verified: AFRY is owner’s engineer on four Gulf wind farms totalling 286 MW, with construction and commissioning oversight under way and EGAT power purchase agreements behind them [41]. RATCH lists its 27 MW Solarist Thungfai solar project as under construction as well [42], so the construction column is a floor in every row it appears. Gulf’s 623 MW is the programme it schedules for commercial operation during 2026, treated here as construction-stage [34].
Expensive gas and low reservoirs would make coal an alluring choice; interestingly, it seems that Thailand has so far heroically resisted the temptations of coal. Thai coal and lignite generation over January to May fell from 14,541 GWh in 2024 to 13,688 GWh in 2025 and 9,019 GWh in 2026, taking coal’s share of generation from 14.3% to 9.1% [25]. Against the same months of 2025, gas-fired generation rose 6,351 GWh, imported electricity 1,292 GWh and hydro 1,200 GWh, while coal fell 4,669 GWh and total demand grew 4,448 GWh [25]. In the year its LNG bill turned upward, Thailand burned less coal and more gas: gas supplied 56% of generation over the 12 months to May 2026, and 61% across January to May alone [25].
The coal fleet is being aged, not replaced [36]. Two of the four plants the National Energy Policy Council suspended in October 2025, Mae Moh units 8 and 9, are coal [13][14]. So the coal risk in a dry, expensive year is that the standing plants run harder, and so far in 2026 they have run less [25].
Everything Thailand is building, and everything it has parked, fits in one picture once each line is verified against its operator.
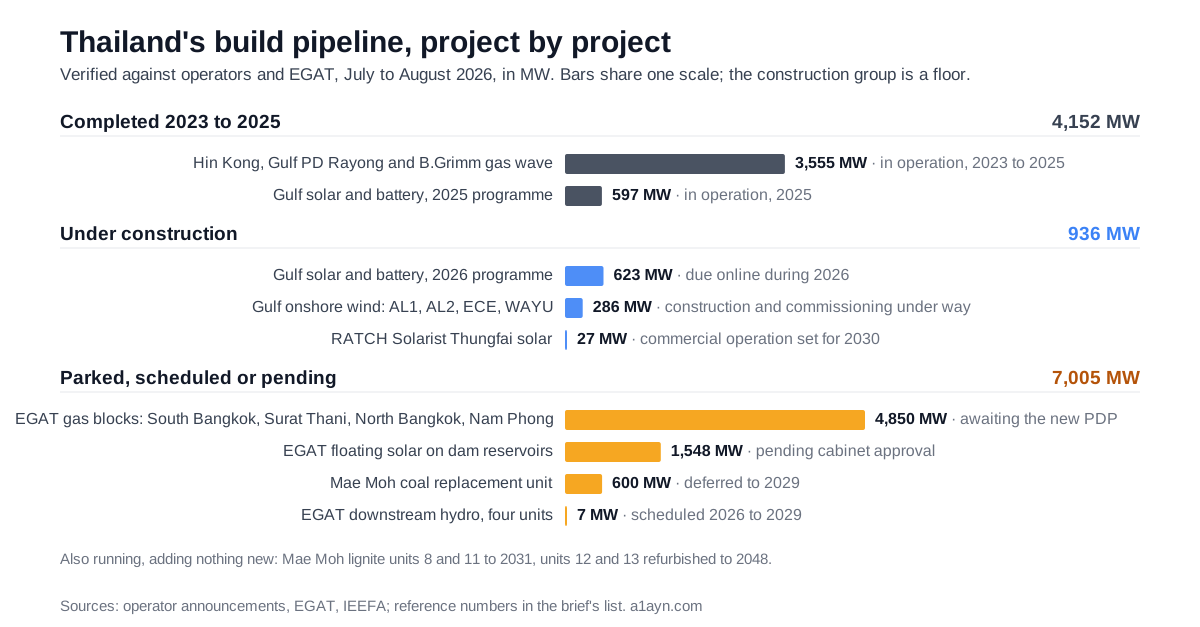
Thailand’s build pipeline, verified against operators and EGAT, July to August 2026 (MW as stated by each source) [13][14][31][32][33][34][35][36][41][42]
Gulf’s two programmes are installed capacity; the contracted figures are 354.3 MW and 370.6 MW [34]. EGAT cancelled tenders for three of the parked gas blocks in 2025 [14].
This picture had to be assembled from operators and EGAT, because the tracker data cannot carry it. Global Energy Monitor’s asset files, the only database that classifies capacity by lifecycle stage, still list the finished gas wave as under construction, record 1,041 MW of operating Thai solar when Gulf’s completions alone exceed that, and carry the deferred coal unit as permitted [12][31][34]. GEM remains the source here for what it does support: Thailand’s cancelled-coal history, 10,726 MW cancelled or shelved against 6,138 MW operating, and the regional contrast, Indonesia’s 14,499 MW of coal under construction [12].
Reading down the pipeline: recent completions are dominated by gas, the current construction is solar and wind in the hundreds of megawatts, and every proposed thermal and conventional hydro project is parked pending the new power development plan.
Who pays for the idle capacity
The National Energy Policy Council suspended four plants in October 2025: North Bangkok, South Bangkok and Nam Phong, which are gas and together about 4 GW, and Mae Moh units 8 and 9, which are coal. A further 0.6 GW was deferred to 2029, and the suspended plants are to resume after that [13][14]. The reason given was oversupply.
IEEFA counted seven privately owned Thai gas plants that ran at a capacity factor below 10% in 2025, meaning each produced less than a tenth of the electricity it could have [14]. Together they hold over 11 GW, more than a quarter of the roughly 40,300 MW operating gas fleet, and they have cost EGAT and ratepayers THB 159 billion, USD 5.02 billion, since 2023 [12][14]. Thailand’s entire LNG bill for 2025 was THB 183 billion [24].
Each owner sells to EGAT under a long-term power purchase agreement that pays for availability rather than for generation, so the owner collects whether or not EGAT calls on the plant, and the independent producers’ contracts pass fuel costs through to EGAT as well [14][26]. The contracts were signed against demand that did not arrive [14]. How Thailand’s single-buyer market produces this pattern is laid out at /data/power-markets/.
Thailand commissioned its newest 3,555 MW of gas capacity into this oversupply between 2023 and January 2025, while 2,072 MW sits mothballed and about 4 GW sits suspended [12][13][31].
The bill arrives through the Ft charge, the fuel-adjustment component of the Thai electricity tariff, and it does not track the import price. A Thai household pays by how much it uses, a factory by its voltage level, and a time-of-use meter prices peak hours above the night’s; the figures that follow are averages across all of them, a simplification this story accepts. For September to December 2026 the Energy Regulatory Commission consulted on four options between 0.1623 and 0.9482 baht per kilowatt-hour, which would have put the average tariff anywhere between 3.95 and 4.73 baht. Its own gas-cost assumption for the period is 363.53 baht per MMBtu, 4.6% above the previous one [26]. The regulator went to the bottom of that range, so the average tariff stays where it was at 3.95 baht per kilowatt-hour, about 12.4 US cents, held there with clawback funds while EGAT continues to carry THB 31.2 billion of accumulated cost, near USD 1 billion [15][26][29].
The exposure does not disappear, it accumulates on a state utility’s balance sheet, which is where the 2022 spike went as well [15].
The world LNG market in 2026
Ras Laffan has been offline since 2 March 2026 after drone strikes, and shipping through the Strait of Hormuz was cut off from 4 March; Qatari and Emirati LNG loadings fell 35 bcm year on year between March and June [17]. The IEA puts the cumulative loss at around 140 bcm of LNG supply across 2026 to 2030, on a forecast that assumes the strait reopens fully in the third quarter of 2026 [17]. The same wars have already impaired two of the three pumps behind the world’s refined-product exports, the previous brief’s subject; buyers of energy are competing for fewer molecules on both sides.
World liquefaction capacity reached 524.5 mtpa at the end of 2025 after 30.1 mtpa of additions, against 437 Mt actually traded, an average utilisation near 83%; the year before it was 494.4 mtpa and 411.24 Mt, so trade grew slightly faster than capacity, 6.3% against 6.1% [19][20]. A record 68.4 mtpa of new liquefaction capacity reached final investment decision during 2025 [19].
Southeast Asia has cancelled or shelved more LNG import capacity than it operates: 63.1 mtpa against 58.2 mtpa, counting import terminals only [4]. Vietnam has cancelled or shelved 24.9 mtpa of import capacity against 1.0 mtpa operating, and 60,900 MW of gas-fired generation against 8,146 MW operating [4][12]. Myanmar stopped importing LNG altogether on affordability grounds [5].
Three pressure points, 2026 to 2030
The framing below is this analyst’s reading of how the pieces align, not a quantitative forecast. These are not alternative futures: the first is already underway, the second can land on top of it, and the first ends at the third.
The bill keeps being socialised. Hormuz reopens within a year, spot settles into the low teens, and Thailand carries the interim through the Ft mechanism and EGAT’s balance sheet as it did in 2022 and again this September. Yadana is extended past 2028, Pailin transfers without a repeat of Erawan, and the accumulated cost grows. This is the path the September decision has already started down, though the two 2028 renewals are consequential commercial acts rather than defaults.
The 2028 handovers go badly. Pailin repeats the Erawan dispute and Yadana’s contract lapses in the same year, taking about 570 mmscfd out of domestic and pipeline supply inside 12 months, Pailin’s 415 mmscfd and Yadana’s remaining 150 mmscfd. Thailand covers it with spot cargoes in whatever market exists in 2028. The observable that would signal it early is the Department of Mineral Fuels’ extension decision, which is due well before the concession ends.
The smoothing runs out. The clawback funds that held the tariff at 3.95 baht are finite and the accumulated balance on EGAT is not falling. At some point the pass-through resumes, Thai industrial demand meets a real price for the first time since 2022, and the 10.8 mtpa of proposed Thai import terminals joins the 15 mtpa already cancelled or shelved. The first pressure point feeds this one, and the second would hurry it. The observable is the clawback balance and EGAT’s receivable, both published each tariff round.
Implications
For Thai industrial buyers. Watch the Ft round and the clawback balance behind it, not the spot print. The September to December decision held the average tariff at 3.95 baht per kilowatt-hour, so the part of the fuel cost the frozen tariff does not recover is being deferred through clawback funds and EGAT’s balance sheet rather than passed through, and what is deferred is eventually paid, at the meter or from the budget.
For anyone modelling Myanmar exposure. Model Yadana. Yetagun ended in 2021 and is inside the base, Zawtika is stable with new platforms, and the 2028 contract date belongs in a calendar next to Pailin’s.
For LNG sellers looking at Southeast Asia. The region has cancelled or shelved more import capacity than it operates. Cancellations accumulate for many reasons, financing and permitting and weak power demand among them, so that is evidence of fragile project economics rather than a demand curve. It is still the direction the region’s developers have moved through two price shocks.
For Thai energy policy. The channel that works is already running: about 3,450 MW of solar entered national statistics in one year, coinciding with the first projects of the ERC’s procurement wave, while the power development plan sat unfinished [38]. Scale it, keep the wind farms coming behind the four already building, and sign the floating-solar approval that holds 1,548 MW at the cabinet’s door [35][41]. In the hours when gas sets the margin, the megawatt-hours those contracts deliver displace the last gas Thailand buys, the spot cargo. And put nuclear under serious study: hydro is capped, coal is being resisted, and every pressure point above is priced by events outside Thailand. A reactor takes longer to build than this window runs, which is not an argument against it; it is the argument for starting the study before 2028 rather than after.
For anyone quoting Thai gas figures. Convert LNG at roughly 1,100 BTU/scf, this brief’s central calibration, with EPPO’s printed 1,000 BTU/scf as the sensitivity case; the printed value itself applies to Myanmar pipeline gas.
Thailand’s gas position is not secure. Thai power stations take 61% of the country’s gas, and 36% of that gas now arrives by sea against 27% two years ago. PTTEP’s chief executive puts his company’s Myanmar operations alone at around 20% of Thailand’s electricity consumption, and one of the two fields still flowing, Yadana, sells into Thailand on a contract that ends in 2028 [23]. What reaches Thailand at that end is set by other people’s wars: Ras Laffan stopped loading in March 2026 and the strait it exports through was cut off two days later, and the price of every uncontracted Thai cargo moved with it [17][18].
It is not good business either. THB 102.7 billion in five months, USD 3.2 billion, 14.9% of the national energy import bill, and that at an average of USD 11.97 per MMBtu while the spot market ran above USD 19 per MMBtu. Behind it sit plants that are paid whether they generate or not, at THB 159 billion since 2023, USD 5.02 billion on IEEFA’s own conversion [14]. Those payments buy availability and reserve margin, which are worth something. What they do not buy is fuel, and Thailand is carrying the cost of capacity it does not dispatch at the same time as an import bill it cannot control.
The one large undeveloped domestic gas option is the contested seabed next to the fields Thailand already produces from, unproven in volume, in cost and in timetable. Reaching it needs a maritime boundary first; Timor-Leste and Australia settled theirs in 2018, and Greater Sunrise remains undeveloped.
About 3,450 MW of solar entered national statistics in one year, coinciding with the first projects of the ERC’s procurement wave, at least 936 MW of solar and wind is under construction today, and Gulf alone has committed a 4,497 MW renewables portfolio in Thailand, 1,532 MW of it already operating [34][38][41][42][43]. In the hours gas sets the price, those megawatt-hours retire the most expensive gas Thailand buys. That is the policy that shrinks the dependence, and nuclear is the study for the decade after.
References
[1] EPPO, Ministry of Energy, Thailand, tables T03_01_01 and T03_02_02. Production and Import of Natural Gas, and Consumption of Natural Gas by Sector: monthly rows January 2024 to May 2026 and published annual averages 2021 to 2025, including the remarks line stating 1,000 BTU/SCF for Myanmar gas. Retrieved 30 July 2026; the workbook path carries an upload month and is rediscovered from the landing page on each refresh. https://www.eppo.go.th/data-energy-statistic/energy-statistic/gas-energy-stat/
[2] Bangkok Post, “Chevron disputes spur PTTEP takeover”. The G1/61 (Erawan) decommissioning-cost dispute between Chevron and the Department of Mineral Fuels, and the delay to the incoming operator’s entry. Paywalled. https://www.bangkokpost.com/business/2076659
[3] Bangkok Post, “Call for smooth gas production at Pailin”. Pailin concession ending 2028, PTTEP 60% and Chevron Thailand 40%, output around 10% of Thai supply, and the ten-year extension route under the Thailand 1 regime. Paywalled. https://www.bangkokpost.com/business/general/2630017
[4] Global Energy Monitor, Global Gas Infrastructure Tracker. Pipeline nameplate capacities and LNG terminal capacity by status; pipelines release November 2025, terminals September 2025. CC BY 4.0. https://globalenergymonitor.org/projects/global-gas-infrastructure-tracker/
[5] ERIA, Research Project Report FY2023 No. 02, “Oil and Gas Strategic Pricing in Myanmar”. Myanmar gas field histories: Yetagun’s April 2021 cessation attributed to depletion with a brief restart later that year, the Petronas and ENEOS withdrawals from the Yetagun blocks in 2022, the 80/20 Thailand/MOGE offtake arrangement for the Yadana and Yetagun projects, and the record of Myanmar ceasing LNG imports. https://www.eria.org/uploads/Oil-and-Gas-Strategic-Pricing-in-Myanmar-.pdf
[6] Global New Light of Myanmar, “PTTEP to add 4 platforms, subsea pipelines at Myanmar’s M-9 offshore block”, September 2025, read 3 August 2026. The Zawtika Phase 1E scope as announced: four new wellhead platforms and subsea pipeline works at the M-9 block, scheduled from 20 September 2025 to 28 February 2026. Phase 1D completion is from PTTEP’s own reporting [23]. https://www.gnlm.com.mm/pttep-to-add-4-platforms-subsea-pipelines-at-myanmars-m-9-offshore-block/
[7] JURIST, 2 June 2026. Cambodia’s initiation of compulsory conciliation under UNCLOS Annex V, following Thailand’s withdrawal from the 2001 memorandum in May 2026, and the commission’s twelve-month reporting period. https://www.jurist.org/news/2026/06/cambodia-initiates-un-mediation-over-thailand-maritime-boundary-dispute/
[8] The Nation (Thailand), 23 June 2026, and Xinhua, 19 June 2026, both carrying the Thai Ministry of Foreign Affairs response. Thailand’s 19 June acceptance of conciliation while stating the outcome is non-binding, the appointment of Sihasak Phuangketkeow as Agent, and Thailand’s position that the scope should cover delimitation only. https://www.nationthailand.com/news/asean/40067767 and https://english.news.cn/20260619/b6352015a4aa4748bc436ad111c5fb4e/c.html
[9] Australian Government, Department of Foreign Affairs and Trade. Australia’s maritime arrangements with Timor-Leste: the compulsory conciliation, the 6 March 2018 boundary treaty and the Greater Sunrise special regime. https://www.dfat.gov.au/geo/timor-leste/australias-maritime-arrangements-with-timor-leste
[10] National Hydroinformatics Data Center (NHC), Thailand. Daily large-dam storage against capacity by operating agency, via thaiwater.net. Figures as at 30 July 2026. https://www.thaiwater.net/
[11] NOAA Climate Prediction Center. Oceanic Niño Index and the five-consecutive-season rule for declaring an episode. https://www.cpc.ncep.noaa.gov/products/analysis_monitoring/ensostuff/ONI_v5.php
[12] Global Energy Monitor, five asset-level power trackers. Global Oil and Gas Plant Tracker (January 2026 release), Global Coal Plant Tracker (January 2026), Global Solar Power Tracker (February 2026), Global Wind Power Tracker (February 2026) and Global Hydropower Tracker (March 2026), all CC BY 4.0, read from the asset-level files behind GEM’s own public tracker maps on 30 July 2026. No Thai agency publishes capacity under construction by technology, which is why the lifecycle columns come from GEM. Each tracker’s file URL, row count, status vocabulary and unit check from that pull is recorded in this site’s snapshot, src/data/power/gem_power_pipeline.json, so every cell of the lifecycle chart can be recomputed from it. https://globalenergymonitor.org/projects/global-oil-gas-plant-tracker/
[13] Bangkok Post, “Weak demand results in suspension of 4 power plants”, 29 October 2025. The four suspended plants named. Paywalled. https://www.bangkokpost.com/business/general/3127982
[14] IEEFA, Christopher Doleman and Sam Reynolds, “Thailand’s gas conundrum: Overbuilt, underutilized, and increasingly expensive”, 26 February 2026. Seven privately owned gas plants below a 10% capacity factor in 2025; THB 159 billion cost to EGAT and ratepayers since 2023; the October 2025 suspension; the unfinalised draft PDP 2024. https://ieefa.org/resources/thailands-gas-conundrum-overbuilt-underutilized-and-increasingly-expensive
[15] Bangkok Post, “Power bills set to rise in final four months”. Reporting the September to December 2026 Ft consultation, including the highest of the four options at 0.9482 baht per kilowatt-hour, and the THB 31.2 billion owed to EGAT. The headline describes the consultation, not the decision that followed. Paywalled. https://www.bangkokpost.com/business/general/3285575
[16] JODI-Gas World Database. Monthly gas balance by country; Thai LNG imports filed in kilotonnes. https://www.jodidata.org/gas/database/data-downloads.aspx
[17] IEA, Gas Market Report Q3-2026. The 35 bcm year-on-year fall in Qatari and Emirati LNG loadings between March and June, the cumulative loss of around 140 bcm of LNG supply across 2026 to 2030, and the forecast assumption that the Strait of Hormuz reopens fully in the third quarter of 2026. https://www.iea.org/reports/gas-market-report-q3-2026/executive-summary
[18] IEEFA, Clark Williams-Derry, “Price volatility: A double-edged sword for the LNG industry”, 21 July 2026. Asian LNG for September delivery above USD 19/MMBtu after Ras Laffan went offline, and the demand response across Asian importers. https://ieefa.org/resources/price-volatility-double-edged-sword-lng-industry
[19] IGU, World LNG Report 2026, July 2026. World liquefaction capacity of 524.5 mtpa at end-2025 after 30.1 mtpa of additions, LNG trade of 437 Mt in 2025 (up 6.3%), and 68.4 mtpa of liquefaction capacity reaching final investment decision during 2025. GECF publishes a higher end-2025 capacity figure, 548 mtpa, under its own methodology; this brief uses IGU consistently across both years. https://www.igu.org/press-releases/world-lng-report-2026
[20] IGU, World LNG Report 2025. World liquefaction capacity of 494.4 mtpa at end-2024 and LNG trade of 411.24 Mt in 2024. https://www.igu.org/
[21] PTTEP, “Change of operator in the Yadana project in Myanmar”. PTTEP International as replacement operator of Yadana and of the Moattama Gas Transportation Company, and the resulting participating interests. https://www.pttep.com/en/newsroom/press-releases/274/statement-3-change-of-operator-in-the-yadana-project-in-myanmar
[22] TotalEnergies, “TotalEnergies has definitively withdrawn from Myanmar”, 20 July 2022. The withdrawal from Yadana and MGTC as both shareholder and operator, announced 21 January 2022 and effective 20 July 2022, and the reallocation of its interest to the remaining partners. https://totalenergies.com/newsroom/totalenergies-has-definitively-withdrawn-myanmar/?lang=eng
[23] Myanmar Energy Monitor, “PTTEP reports 2024 production from Yadana, Zawtika”, 12 February 2025. Reporting PTTEP’s management discussion and analysis: Yadana production of 443 mmscfd and Zawtika of 302 mmscfd in 2024; 250 mmcfd exported to Thailand from Yadana in 11M 2024, down 13% year on year; Chevron’s withdrawal on 1 April 2024 leaving PTTEP with 62.963%; the December 2024 filing on drilling a further Yadana well in 2025; and the chief executive’s statement that PTTEP’s Myanmar operations produce the equivalent of around 20% of Thailand’s electricity consumption. https://energy.frontiermyanmar.com/pttep-reports-2024-production-yadana-zawtika
[24] EPPO, table T06_01_03, Value of Energy Import. Million baht, by energy type, full years 2023 to 2025 and January to May 2025 and 2026, with LNG and pipeline natural gas as separate rows. Retrieved 30 July 2026. https://www.eppo.go.th/data-energy-statistic/energy-statistic/valuable-energy-stat/
[25] EPPO, table T05_02_02, Monthly Power Generation by Fuel Type. GWh by fuel, monthly, January 2024 to May 2026: the coal and lignite, hydro, natural gas and imported-electricity series used here. Retrieved 30 July 2026. https://www.eppo.go.th/data-energy-statistic/energy-statistic/electric-energy-stat/
[26] ERC, news release on the September to December 2026 Ft consultation, and Kaohoon International, “Fixed Electricity Tariffs to Pressure SPPs Amid Rising Gas Costs”, 13 July 2026. The regulator’s own consultation: four Ft options from 0.1623 to 0.9482 baht per unit against a 3.78 baht base tariff, an average tariff of 3.95 to 4.73 baht. The Kaohoon piece carries the 363.53 baht per MMBtu gas-cost assumption and the clawback mechanism used to hold the average tariff at 3.95 baht. https://erc.or.th/th/news-release/3455 and https://www.kaohooninternational.com/markets/586567
[27] NOAA Climate Prediction Center, ENSO Diagnostic Discussion. El Niño conditions present and expected to strengthen, with a 97% chance of persisting into early 2027, July 2026 issue. https://www.cpc.ncep.noaa.gov/products/analysis_monitoring/enso_advisory/ensodisc.shtml
[28] US Energy Information Administration, Henry Hub natural gas spot price, STEO series NGHHUUS. Monthly, USD per MMBtu; January to May 2026 readings of 7.72, 3.62, 3.04, 2.77 and 2.94, averaging 4.02. Public domain. https://www.eia.gov/outlooks/steo/
[29] US Federal Reserve H.10, Thailand / United States foreign exchange rate, monthly, via FRED series EXTHUS. Baht per US dollar: 31.28 in January 2026, 31.25 February, 32.26 March, 32.29 April and 32.49 May, averaging 31.91 across the five months. Conversions of January-to-May 2026 figures use that average; the 2023 LNG bill converts at the same series’ 2023 average, 34.78, and PTTGC’s 2022 result at the 2022 average, 35.05. Public domain. https://fred.stlouisfed.org/series/EXTHUS
[30] World Bank, Commodity Markets monthly data (the Pink Sheet), series “Liquefied natural gas, Japan”. Japan LNG import price, CIF, in USD per MMBtu: 11.49 in January 2026, 11.32 February, 11.42 March, 15.65 April and 12.88 May, averaging 12.55; the sheet marks its two most recent months as estimates, which covers the May figure. Compiled by the World Bank from Official Statistics of Japan and World Gas Intelligence. Retrieved 31 July 2026. https://www.worldbank.org/en/research/commodity-markets
[31] RATCH Group, “RATCH Group commemorates success of Hin Kong Power Plant, 1,400 MW contracted capacity fully operated”. Hin Kong block 1 in commercial operation from 1 March 2024 and block 2 from 1 January 2025, under a 25-year power purchase agreement with EGAT. https://www.ratch.co.th/en/updates/activities/1248/ratch-group-commemorates-success-of-hin-kong-power-plant-1400-mw-contracted-capacity-fully-operated
[32] Kaohoon International, “GULF Launches Commercial Operation of GPD Unit 4 with 662.5MW Capacity”, 1 October 2024. The fourth and final unit of the Gulf PD project in Rayong selling to EGAT from 1 October 2024; units 1 to 3 entered operation between March 2023 and March 2024. https://www.kaohooninternational.com/markets/545329
[33] Global Energy Monitor wiki, “Ratchaburi (B.Grimm) power station”. Described as an operating station of at least 280 MW, contradicting the construction status in GEM’s asset file. https://www.gem.wiki/Ratchaburi_(B.Grimm)_power_station
[34] Kaohoon International, “GULF Commences Operation of 2 Solar Farms to Ease Fuel Price Volatility”, 5 January 2026. Gulf’s 2025 completions of seven solar and solar-battery projects totalling 354.3 MW contracted and 596.7 MW installed, and its 2026 pipeline of six projects totalling 370.6 MW contracted and 622.8 MW installed. https://www.kaohooninternational.com/markets/573597
[35] EGAT, Power Plant Development Projects, read 31 July 2026. The thermal list, all marked pending finalisation of the new PDP: Nam Phong block 3 (650 MW gas), the 600 MW Mae Moh replacement, South Bangkok blocks 5-7 (2,100 MW gas), Surat Thani blocks 1-2 (1,400 MW gas) and North Bangkok block 3 (700 MW gas); four downstream hydro units totalling 6.75 MW; and 1,548 MW of floating solar pending cabinet approval. https://www.egat.co.th/home/en/power-plants-development/
[36] Mongabay, “Anguish for residents as Thailand’s most polluting coal plant gets new lease of life”, 1 October 2025. Mae Moh units 8 and 11 extended from scheduled 2025 retirement to 2031, and units 12 and 13 to be refurbished to operate until 2048. https://news.mongabay.com/2025/10/anguish-for-residents-as-thailands-most-polluting-coal-plant-gets-new-lease-of-life/
[37] EGAT, Contracted Generating Capacity, June 2026. EGAT’s own plants at 15,155.02 MW, listed unit by unit: 8,400 MW combined cycle, 2,607 MW thermal, about 3,000 MW hydro and 1,000 MW pumped storage. The suspended North Bangkok, South Bangkok and Nam Phong blocks remain in the table. https://www.egat.co.th/home/en/statistics-all-egat/
[38] Ember, Yearly Electricity Data, full release. Thailand capacity by fuel in GW, compiled independently of GEM from energy-agency statistics: for 2025, gas 38.83, coal 5.84, hydro 3.13, solar 6.84, wind 1.54 and bioenergy 4.31, with solar at 3.39 in 2024 and bioenergy peaking at 4.50 in 2022. Also the generation and demand series in TWh used for 2022: electricity demand 209.17 in 2019 and 213.78 in 2022, hydro generation 4.54 rising to 6.60 and other-fossil generation 0.72 rising to 1.73 between 2021 and 2022; and the yearly hydro generation series 2000 to 2025 used in the ENSO correlation. The latest year may be provisional. CC BY 4.0, retrieved 31 July 2026. https://ember-energy.org/data/yearly-electricity-data/
[39] PTT, The 7th Gas Separation Plant (GSP7) Project, and Oil & Gas Journal, “Thailand’s PTT lets contract for new Rayong gas processing plant”, 27 January 2022. PTT’s project page: 460 mmscfd of feed gas, recovering ethane and fractionating propane, LPG and natural gasoline. The OGJ piece: six plants at two locations, feed gas from the Gulf of Thailand, 2.66 bcfd nameplate, products used as petrochemical feedstocks and fuel including cooking gas. https://procurement.pttplc.com/en/page/index/2092 and https://www.ogj.com/refining-processing/gas-processing/new-plants/article/14232788/thailands-ptt-lets-contract-for-new-rayong-gas-processing-plant
[40] Kaohoon International, “PTTGC Bounces Back to Book A Billion Baht of Net Profit in 2023”, 12 February 2024. PTTGC’s 2022 net loss of THB 8,752 million, which included a hedging loss of THB 23,057 million, and the return to a THB 999 million profit in 2023. https://www.kaohooninternational.com/markets/536527
[41] AFRY, owner’s engineer appointment for four Gulf Development onshore wind farms, 19 May 2026, as carried by Thailand Construction and Engineering News. AL1 (48 MW, Chumphon), AL2 (70 MW, Prachuap Khiri Khan), ECE (90 MW, Mukdahan) and WAYU (78 MW, Chaiyaphum), 286 MW together: project management, design review, and construction and commissioning oversight, with long-term EGAT power purchase agreements. https://thailand-construction.com/afry-appointed-owners-engineer-for-four-onshore-wind-farm-projects-in-thailand-developed-by-gulf-development-pcl-total-capacity-of-286-mw/ and https://renewablesnow.com/news/afry-tapped-as-owners-engineer-for-286-mw-thai-wind-portfolio-1294797/
[42] RATCH Group, project locations, read 2 August 2026. The Solarist Thungfai solar project in Lampang, 27 MW installed, listed as under construction, with a 25-year EGAT power purchase agreement signed in December 2023 and commercial operation scheduled for 2030. https://www.ratch.co.th/en/our-business/project-locations
[43] Gulf Development, company overview, read 2 August 2026. The committed renewable portfolio in Thailand: “a total installed capacity of 4,497 MW, of which 1,532 MW is operational by 2025”. https://www.gulf.co.th/en/about-gulf/the-company
[44] Thailand, Second Nationally Determined Contribution (NDC 3.0), submitted to the UNFCCC, cabinet-approved 4 November 2025. The 2035 target: net greenhouse gas emissions cut 47% from 2019 levels, to 152 MtCO2e against a 2019 net level of 287.2 MtCO2e. https://unfccc.int/sites/default/files/2025-11/TH%20NDC%203.0.pdf
[45] PTTEP, “Statement 3: Change of operator in the Yadana project in Myanmar”. The operator transition itself, from the incoming operator: PTTEP International’s assumption of operatorship on TotalEnergies’ withdrawal, with production continuity as the stated priority. https://www.pttep.com/en/newsroom/press-releases/274/statement-3-change-of-operator-in-the-yadana-project-in-myanmar
[46] Chevron Thailand, “Chevron completes Total Wellhead Platform Reuse at Chaba B”, 2026, also carried by the Bangkok Post. The first whole-platform reuse in the Gulf of Thailand: topside and jacket relocated from a decommissioned site to Chaba B, completed early July 2026 with production planned for 2027, about 4,280 tonnes of CO2 equivalent avoided against decommissioning and new construction, approved by the Department of Mineral Fuels. https://thailand.chevron.com/en/news/latest-news/2026/chevron-completes-total-wellhead-platform-reuse-at-chaba-b and https://www.bangkokpost.com/business/general/3293989/chevron-completes-total-wellhead-platform-reuse-at-chaba-b
Notes on method
Data windows. Thai supply and demand figures are EPPO monthly data through May 2026, the latest published at the time of writing, and the JODI comparison covers 29 overlapping months. Reservoir figures are a single daily observation, 30 July 2026, from a feed that carries no history.
Capacity and its denominators. Capacity by lifecycle stage is a 30 July 2026 pull of five Global Energy Monitor trackers; construction is used as the proxy for a final investment decision, because GEM publishes no FID field. That column proved stale for Thailand: all seven gas units the January-to-March 2026 tracker releases list as under construction reached commercial operation between March 2023 and January 2025 by their operators’ own announcements, so the capacity table originally built from GEM was withdrawn and replaced by the two capacity charts: operating capacity cross-checked against Ember’s independently compiled statistics, and the build pipeline assembled from operator and EGAT sources. The corrected operating gas fleet is about 40,300 MW of physical nameplate; EGAT’s June 2026 contracted-capacity tables (its own 15,155 MW plus 18,159 MW of IPP, 9,334 MW of SPP and 6,235 MW of imports, a grid total near 48.9 GW) sit on a different denominator, since SPP and industrial plants sell part of their capacity outside the EGAT grid, and the two are stated here rather than reconciled. EGAT’s hydro and pumped-storage list sums to within 2% of GEM’s hydro figure, which corroborates that column; GEM’s Thai solar operating figure is contradicted by operator filings and is not used.
Pipelines and fields. Pipeline utilisation compares a single month’s flow against annual nameplate and indicates direction rather than a precise rate. EPPO folded the Bongkot Tai column into Bongkot between 2021 and 2025, so those two fields are compared here as one complex; read separately, Bongkot appears to rise 240 mmscfd.
The EPPO balance. EPPO’s supply and consumption tables do not close: over the 12 months to May 2026 supply averages 4,715 mmscfd against 4,564 consumed, and the monthly difference runs from −325 to +475, including months where consumption exceeds supply. EPPO publishes no reconciliation, so the residual is shown as unexplained rather than attributed to losses. The Erawan handover and Pailin concession details come from Bangkok Post reporting that sits behind a paywall; the production series that corroborates them is EPPO’s.
Prices and conversions. In EPPO’s import-value table, LNG and pipeline natural gas are separate rows: the six commodity rows sum to the published total to within 0.01 million baht in every column, and dividing each row by its matching volume gives THB 371 to 404 per MMBtu for LNG against 299 to 352 for pipeline gas across four windows, so the LNG line is the seaborne cost alone. Whether JODI’s terajoule series for Thailand is compiled independently of EPPO or filed by the same ministry could not be established; if both trace to one reporter, the r = 0.995 correlation is a check on conversion conventions rather than independent confirmation.
The ENSO correlation. It pairs the annual mean of NOAA’s ONI anomaly with Ember’s yearly Thai hydro generation over 2000 to 2025, same-year and one-year-lag, 26 and 25 pairs; at that sample size the lagged −0.46 clears the 5% significance bar and explains about a fifth of the variance. The series are annual, autocorrelated, and span years in which hydro capacity and operating rules changed, so it is a descriptive association indicating direction and rough size, not a forecast.